Reporting is available in all project and can be accessed from the Project Homepage or from anywhere within the project by clicking the 'Reports' button in the upper right corner of the secondary navigation bar.
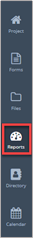
- Click the Reports icon on the left navigation pane.
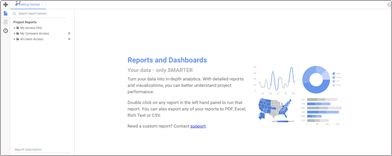
- The reports pane will open.
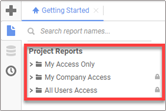
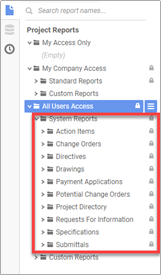
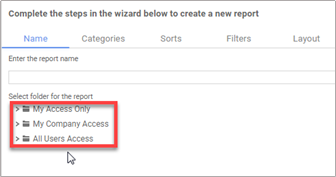
- There are three folders contained in the reports tree.
- My Access Only – contains reports you are currently working on and are accessible to the User only.
- My Company Access – Reports that are ready to use on the project and accessible to all users for your company.
- All Users Access – Reports which are published and ready for use by all project users.
- By default all users will have access to All User Reports in the System Reports The reports will be organized by the form type name. Reports contained in this folder are locked and cannot be edited. To make changes to any System Report the report must be cloned to either My Access Only or My Company Access Custom Reports folders.
- Although any user can run any System Report, they must have access to the form data to generate the report. If they do not have access to the data contained in the report they will only receive a blank report.
- To create a new report click the plus sign (+) in the top left corner of the screen.
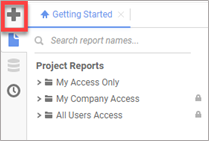
- The User will be prompted to select the report type to be created.
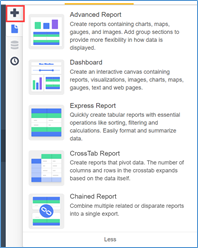
- Express Report – Quickly create tabular reports with essential operations like sorting, filtering and calculations. Easily format and summarize data.
- Advanced Report – Create reports containing charts, maps, gauges, and images. Add group sections to provide more flexibility in how data is displayed.
- Crosstab Report – Create reports that pivot data. The number of columns and rows in the crosstab expands based on the data itself.
- Dashboard – Create interactive canvas containing reports, visualizations, images, charts, maps, text, and web pages.
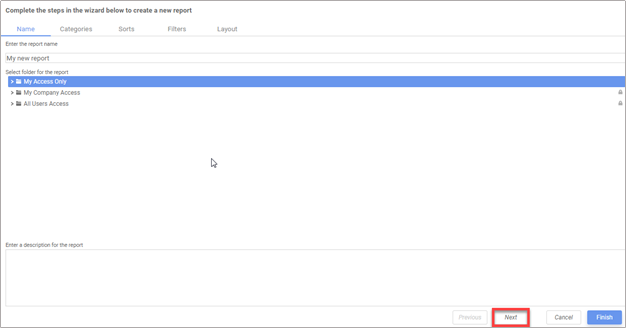
- Enter the report name in the blank field.
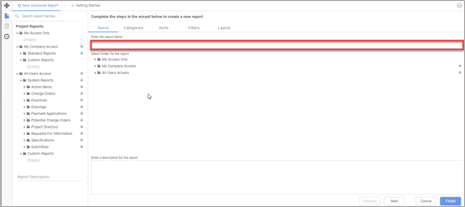
- Select the folder where the report is to be saved by clicking the folder title.
- Click the Next button to open the Categories tab.
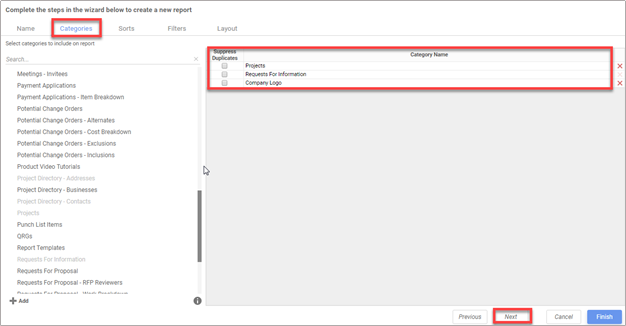
- Double-click the form name where the data resides (i.e. Request for Information, Projects, Company Logo) to add this information to the report. This will allow access to the information contained in the RFI data form, project specific data such as company name and address and the company logo. Click the Next button to open the Sorts tab.
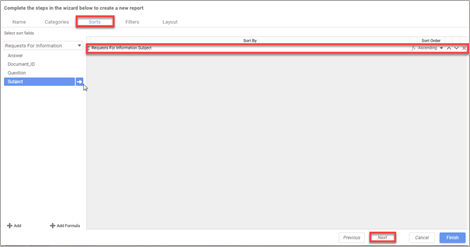
- Double-click the primary field to sort by and click the dropdown to choose Ascending or Descending. Click the Next button to open the Filters tab.
- Filters may be applied to the field types using an operator and entering specific filter criteria.
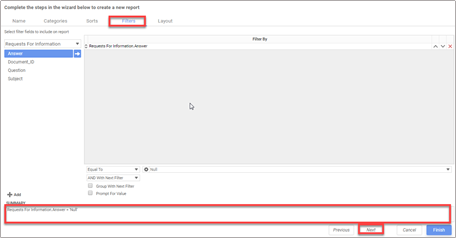
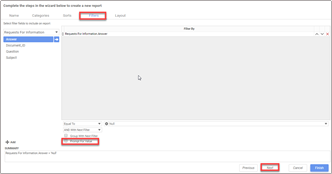
Note: If the user will be required to enter a value, click the Prompt for Value radio button. Click the Next button to open the Layout tab.
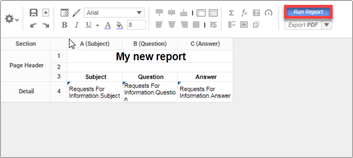
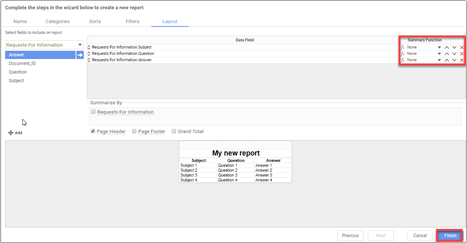
- Double-click each field, in the order the fields should show on the report.
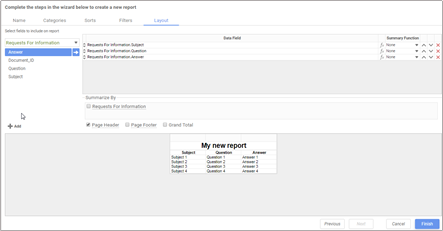
Note: To reorder the columns, use the up or down arrows, in the top right hand grid, to move the columns to the desired location. Click the Finish button.
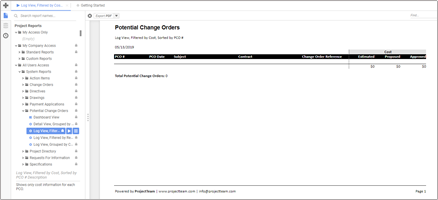
- To view the draft report, click the Run Report button.