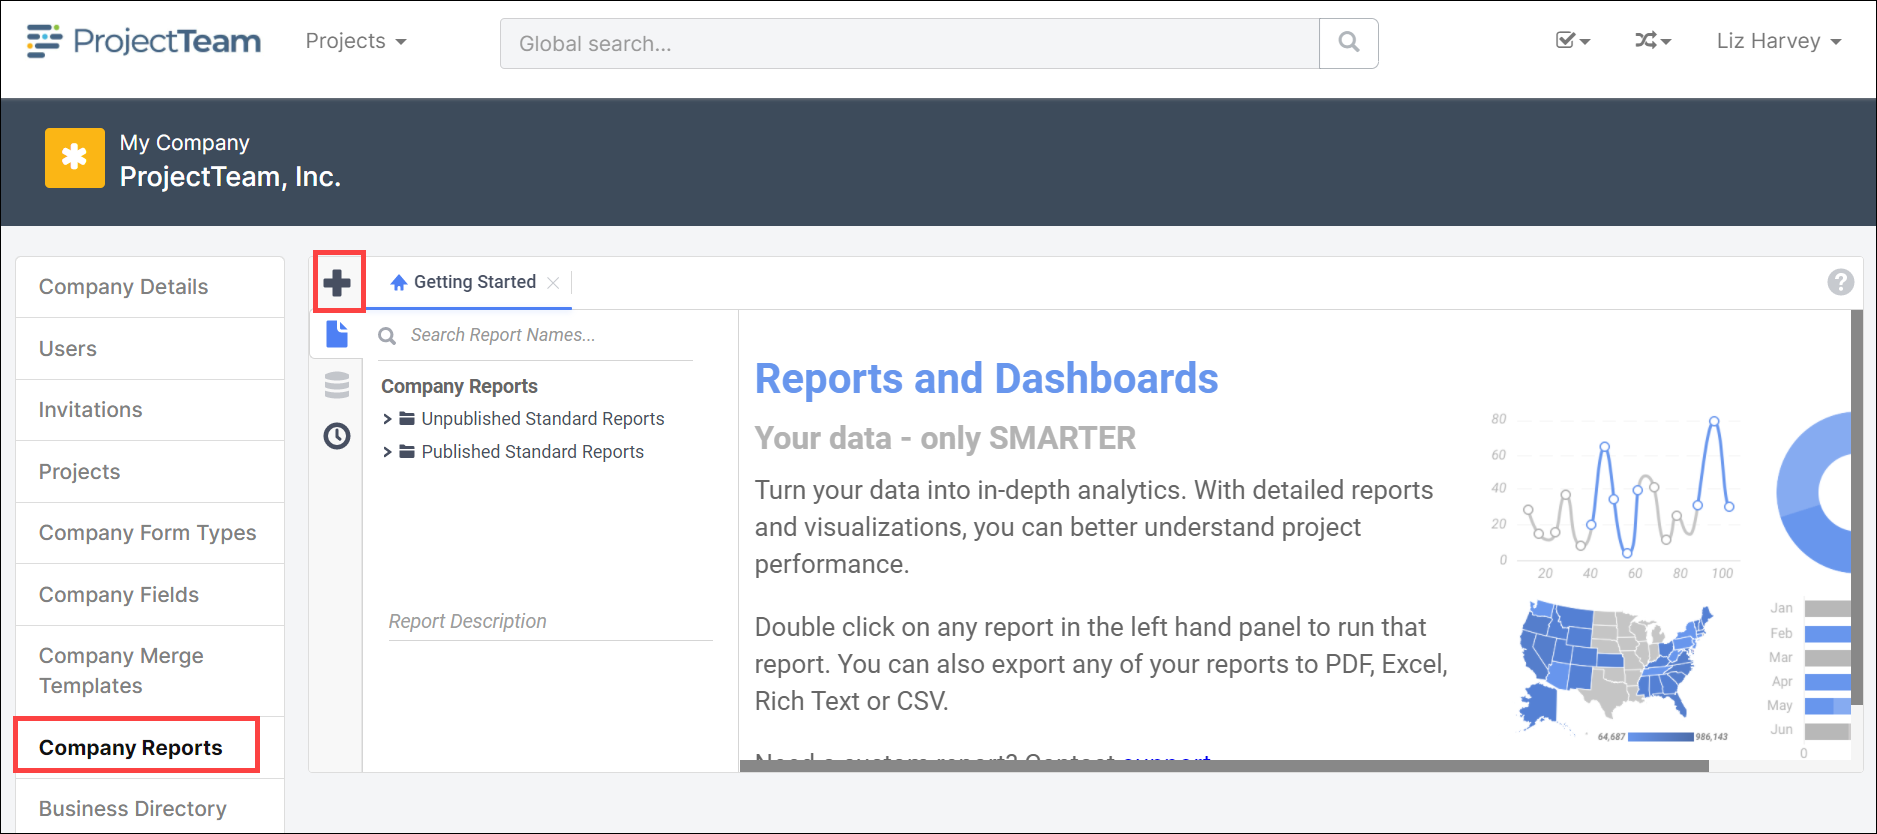
- From My Company, click Company Reports on the left hand navigation.
- Reports and Dashboards will load. From the top navigation of the Reports area, click the Plus icon button.
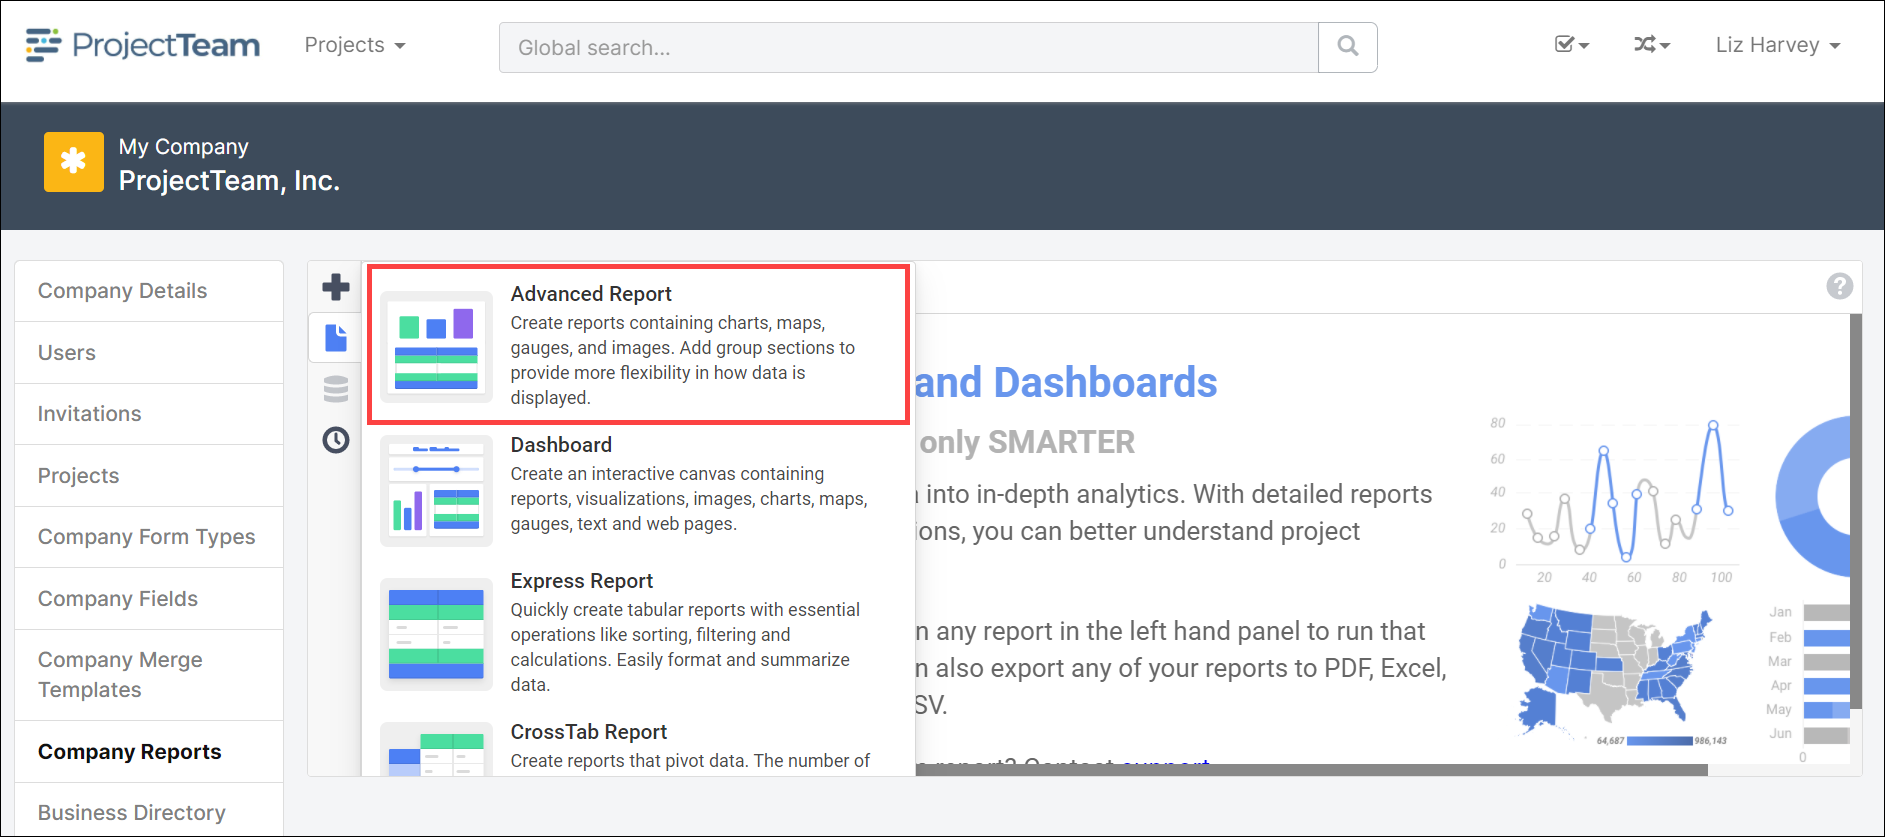
- Select the appropriate report type.
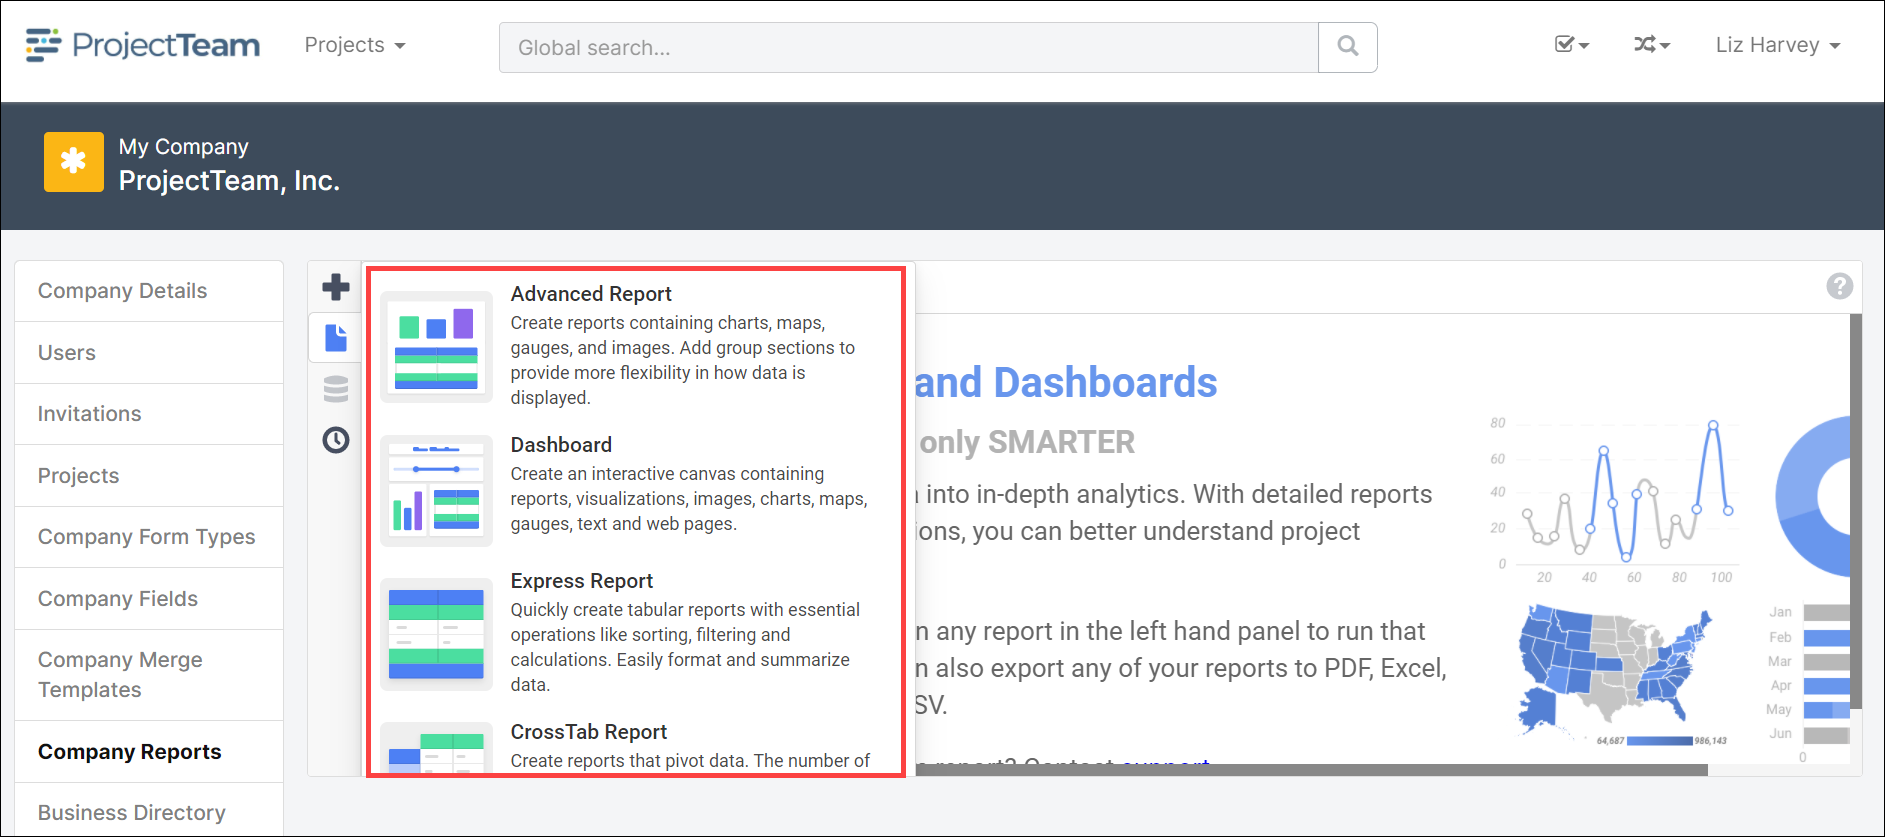
- Express Report – Quickly create tabular reports with essential operations like sorting, filtering, and calculations. Easily format and summarize data.
- Enter the report name in the blank field.
- Select appropriate folder to create report within.
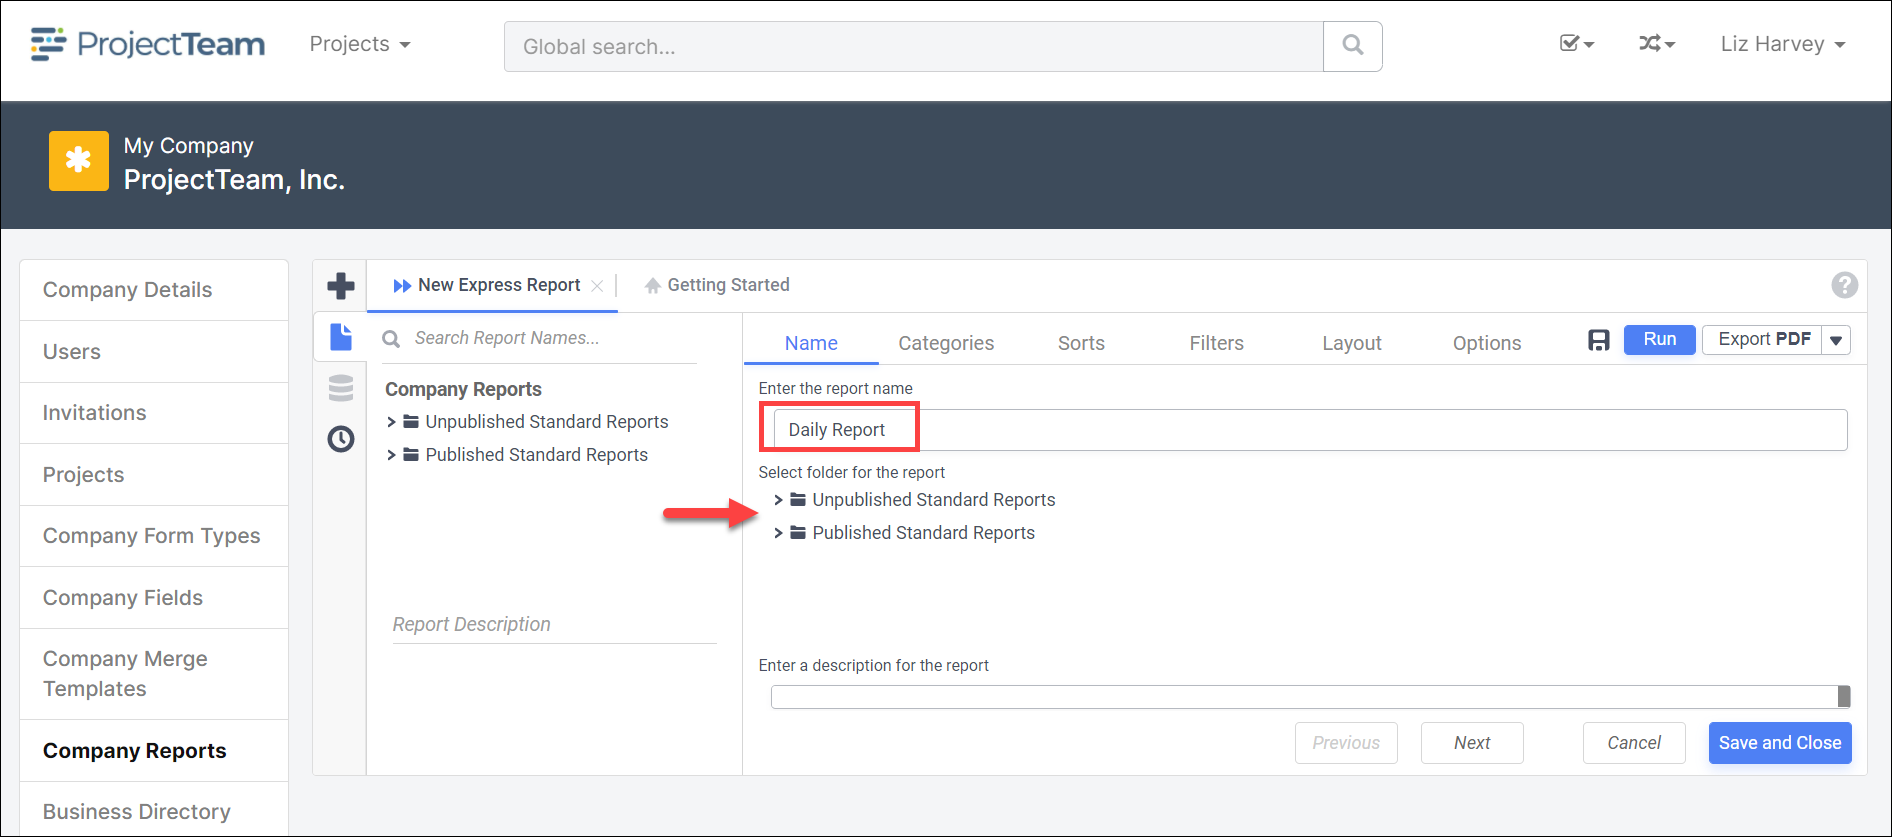
Note: It is recommended to create the report in the Unpublished folder first. Once a report has been created it can be moved to the Published folder. Reports in the Published folder will display in the reports within a project under My Company Access\Standard Reports.
- Click the Next button or Categories, select form types to be included in report. Click plus icon at the bottom of the list or the arrow icon next to appropriate form type to add to the report.
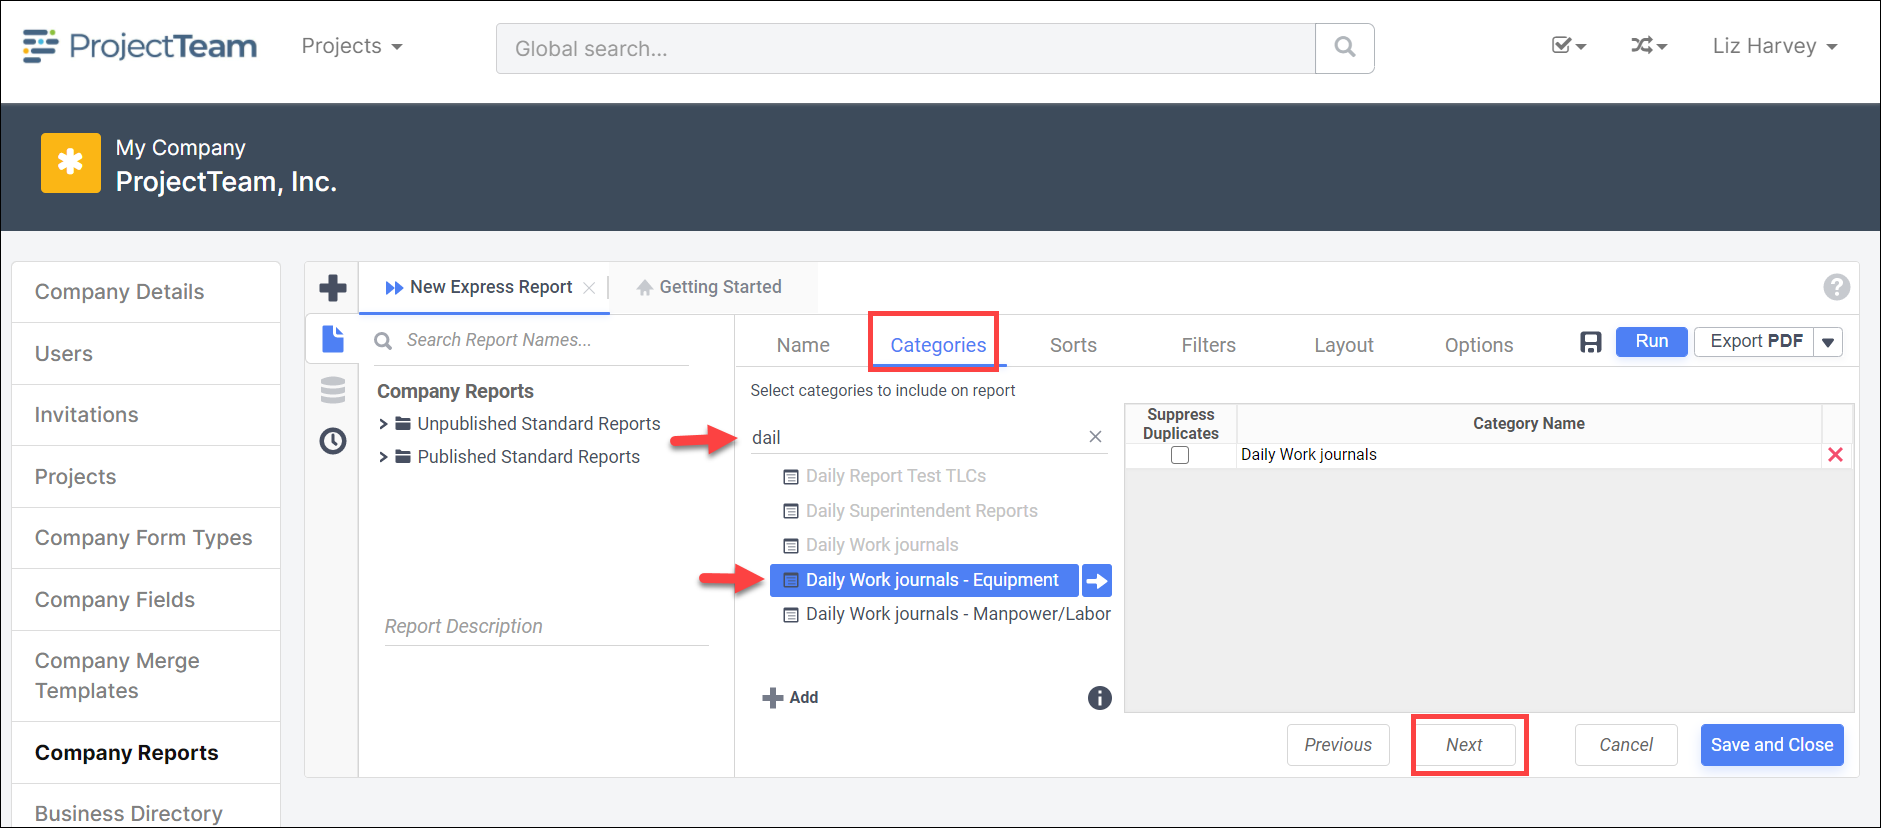
Note: Multiple form types may be added to a Company Report but any project custom from types cannot be added to Cross Project Reports.
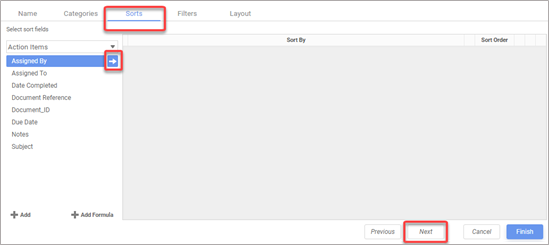
- Click the Next button or Sorts, Click plus icon at the bottom of the list or the arrow icon next to appropriate field type to add to the report.
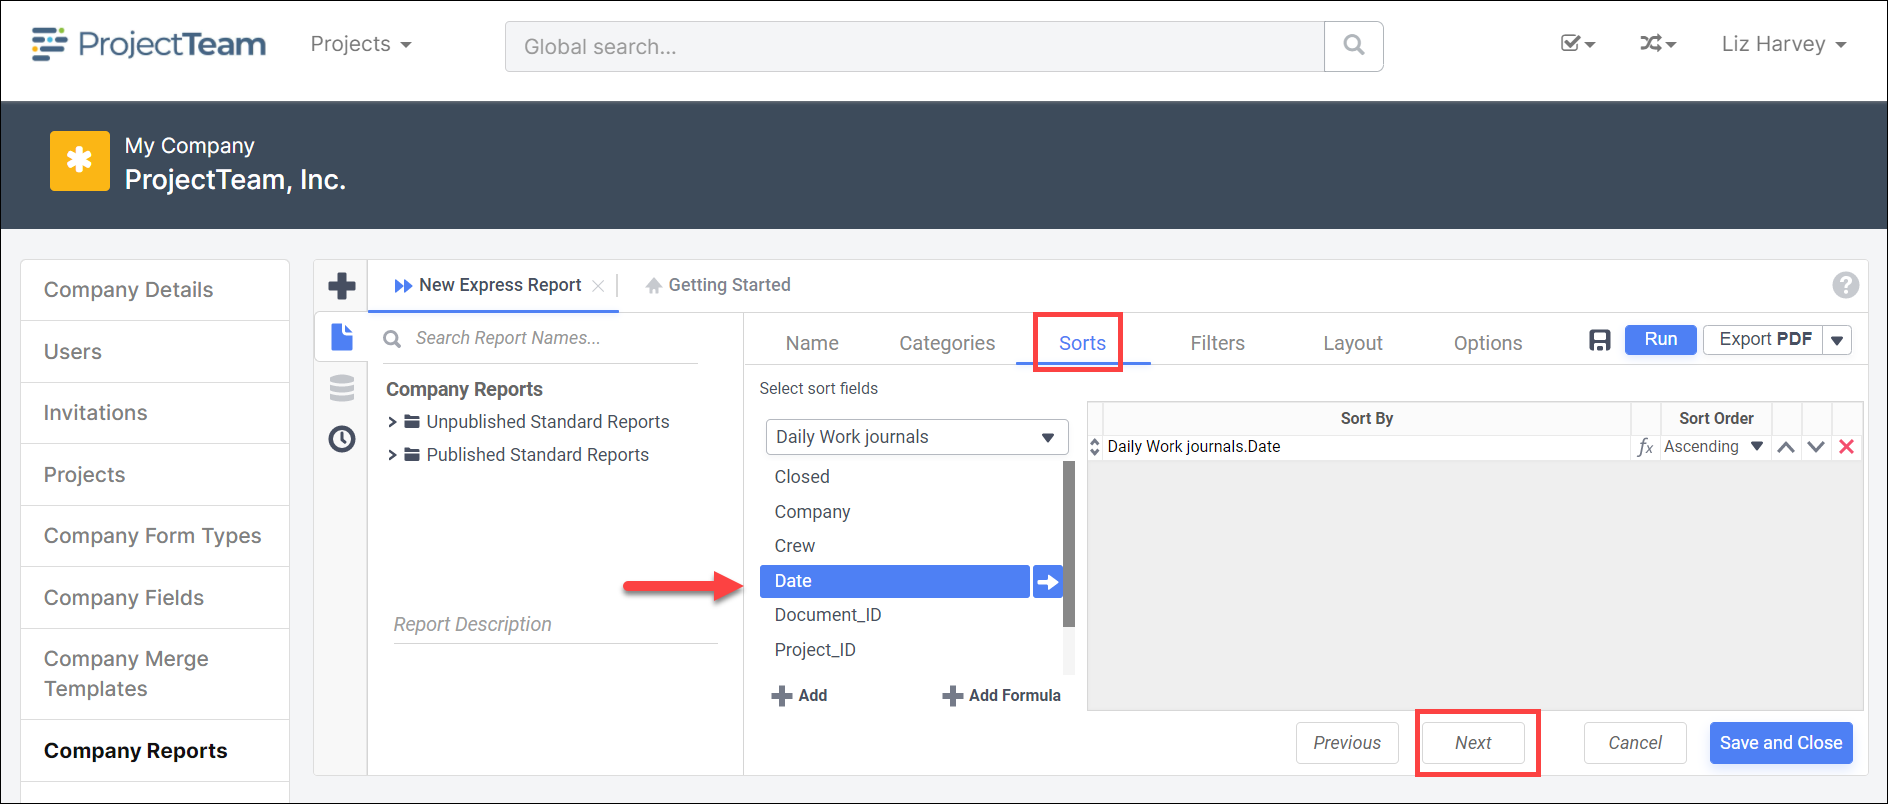
Note: Sorts may be applied to the field types. With the Field Type selected, choose the appropriate sort to apply to the report.
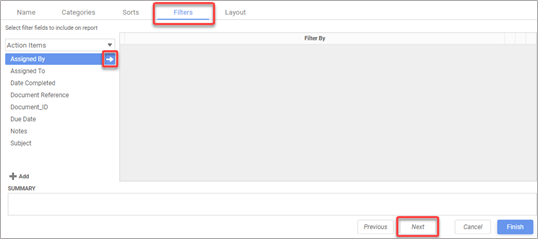
- Click the Next button or Filters, select form type from the drop down and appropriate field. Click plus icon at the bottom of the list or the arrow icon next to appropriate field type to add to the report.
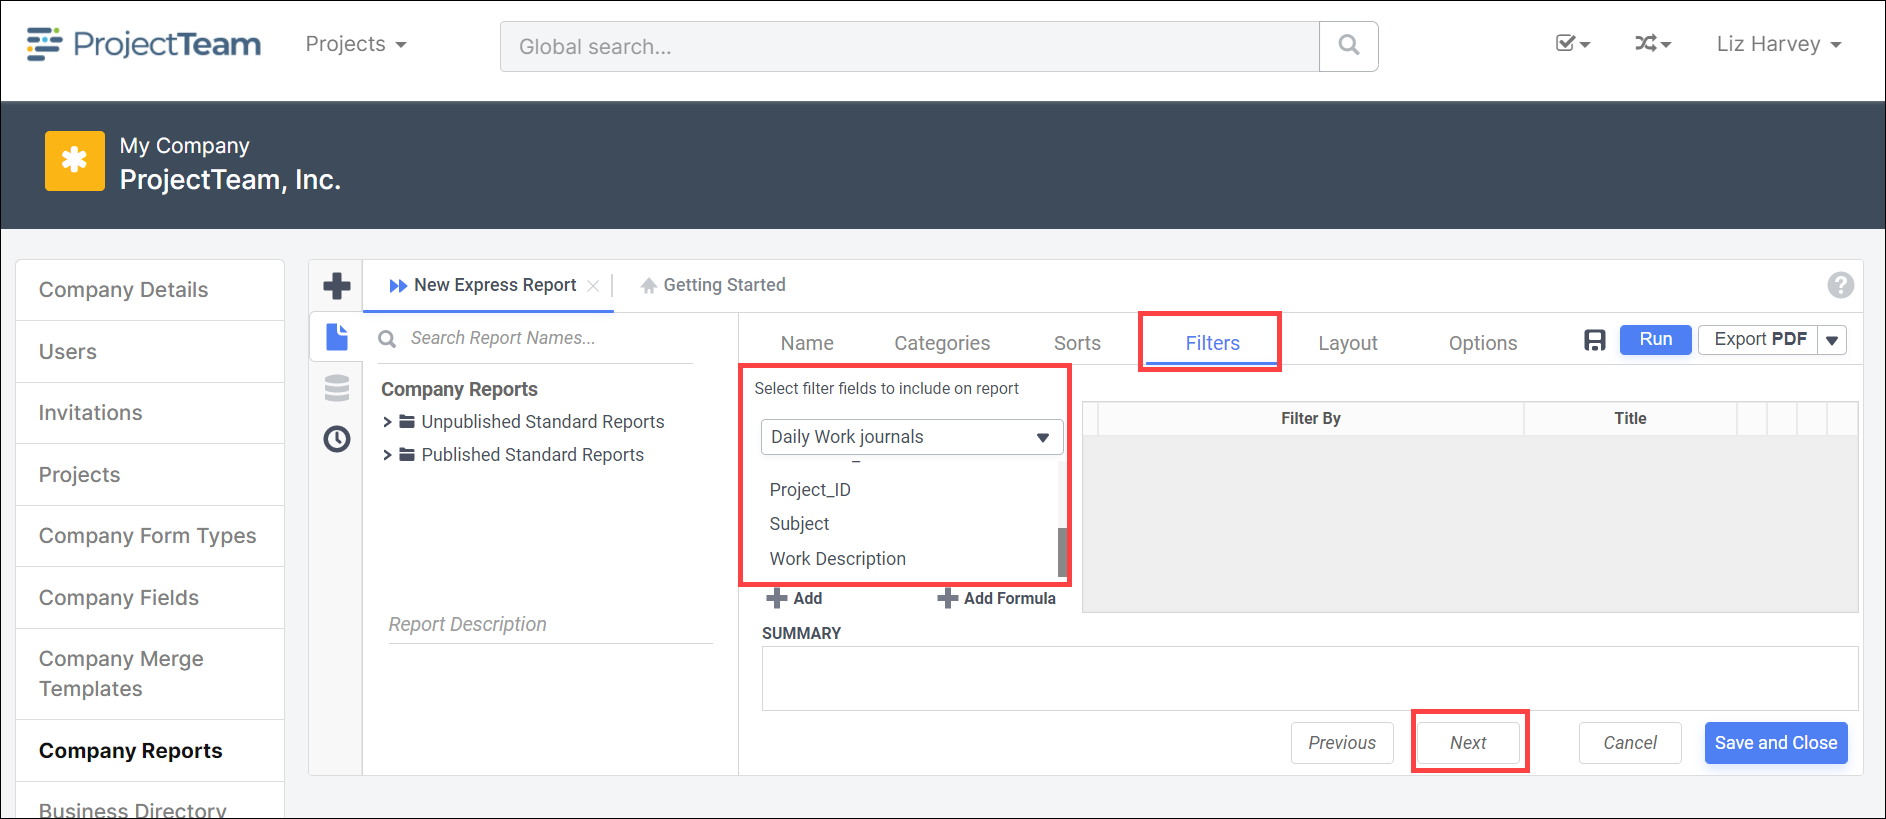
Note: Filters may be applied to the field types. With the Field Type selected, choose the appropriate filter value to apply to the report.
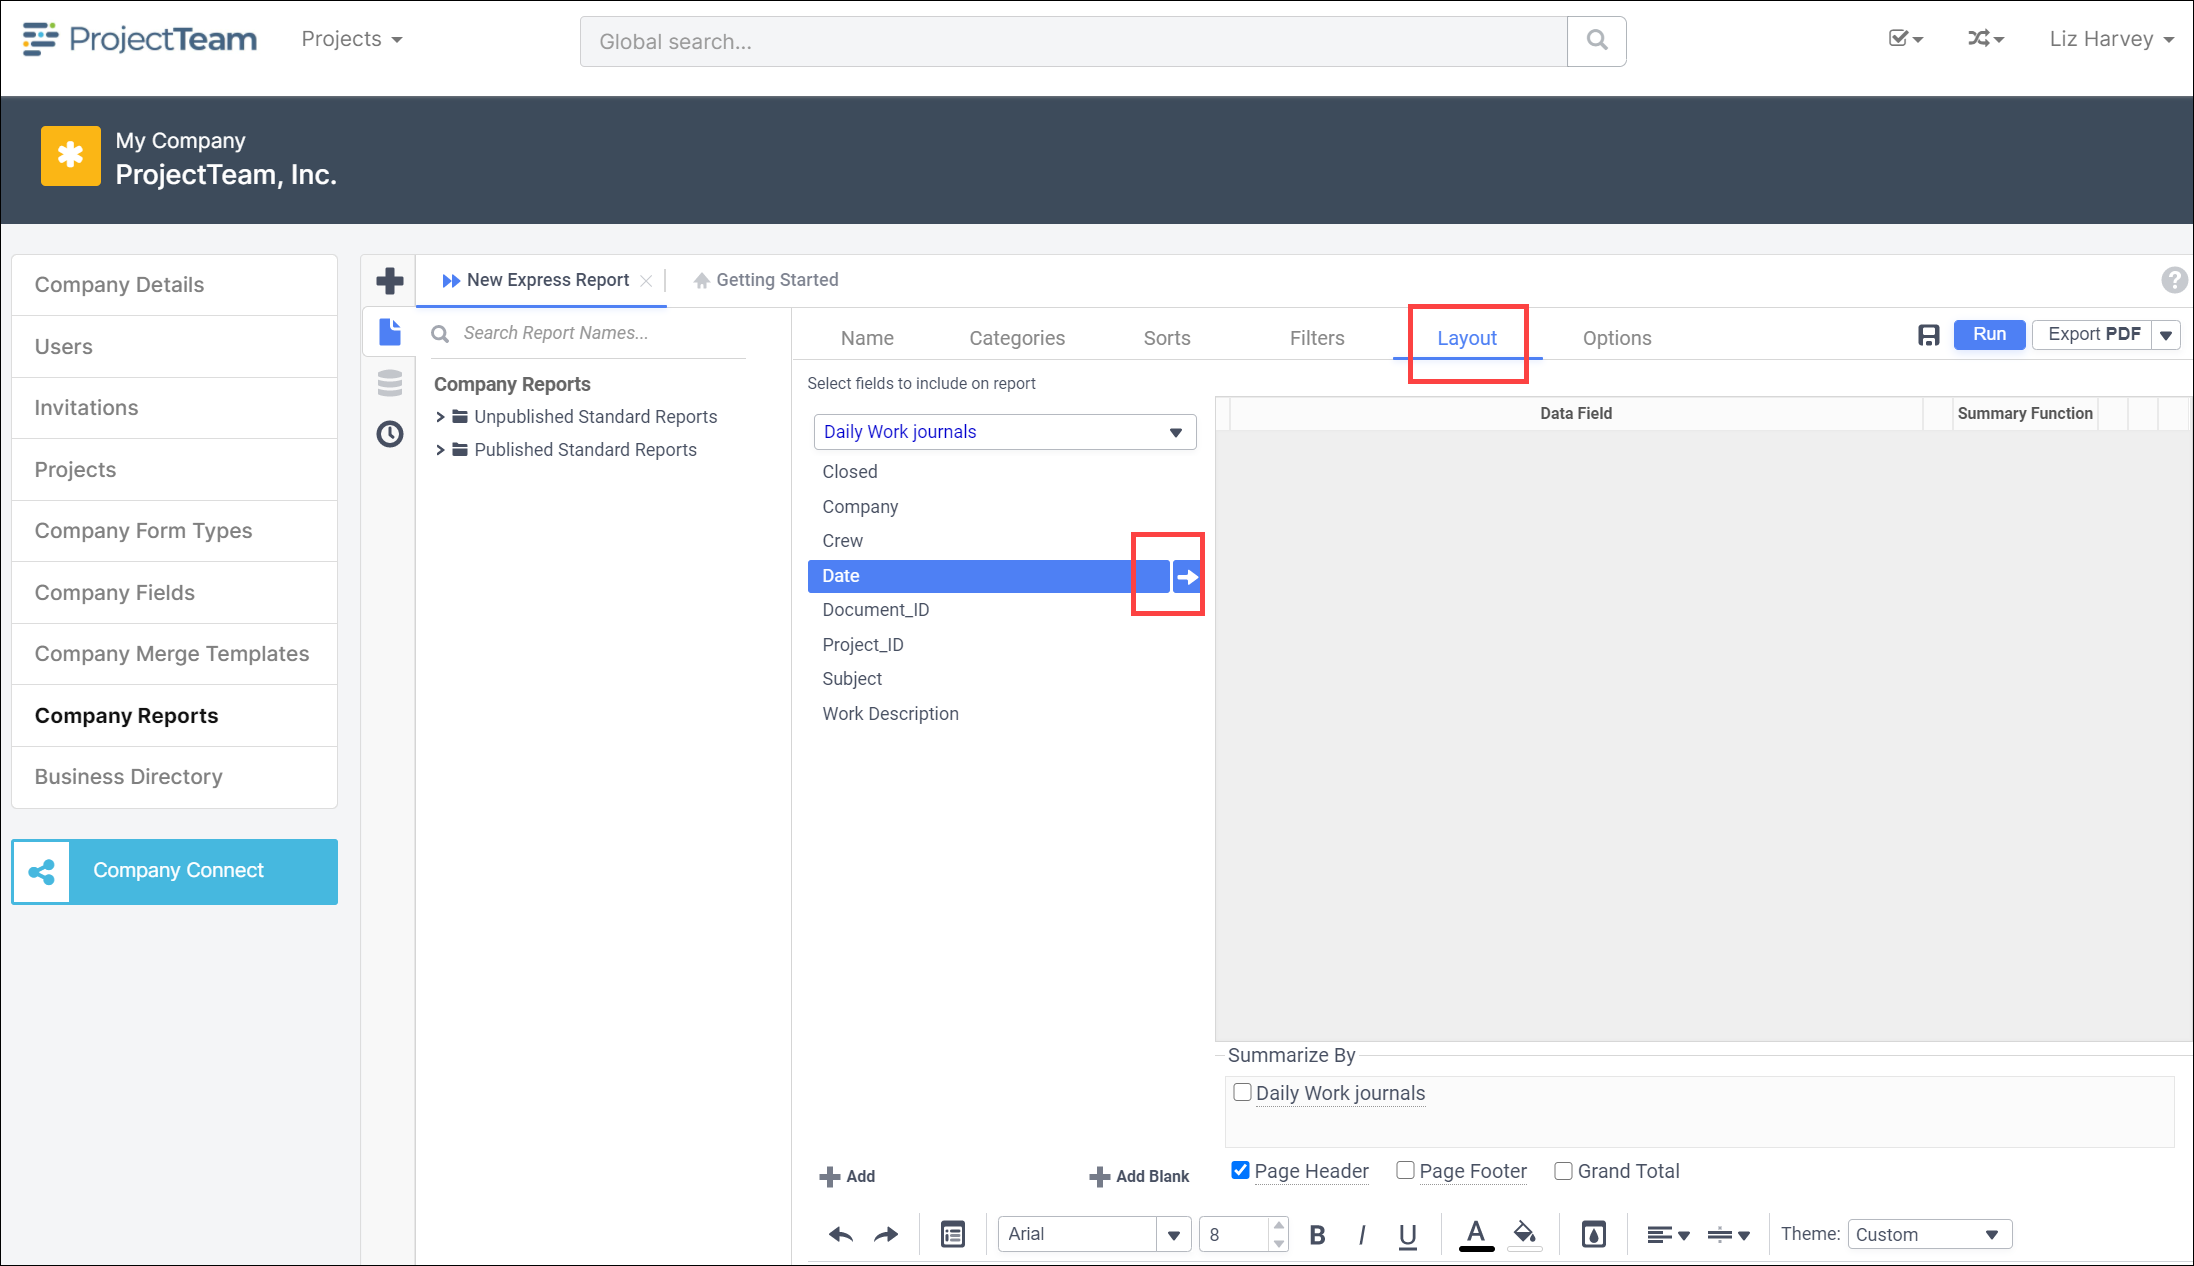
- Click the Next button or Layout, select the field type and click the arrow icon to add to the appropriate Source (Row Header, Column Header, Tabulation Data are all required).
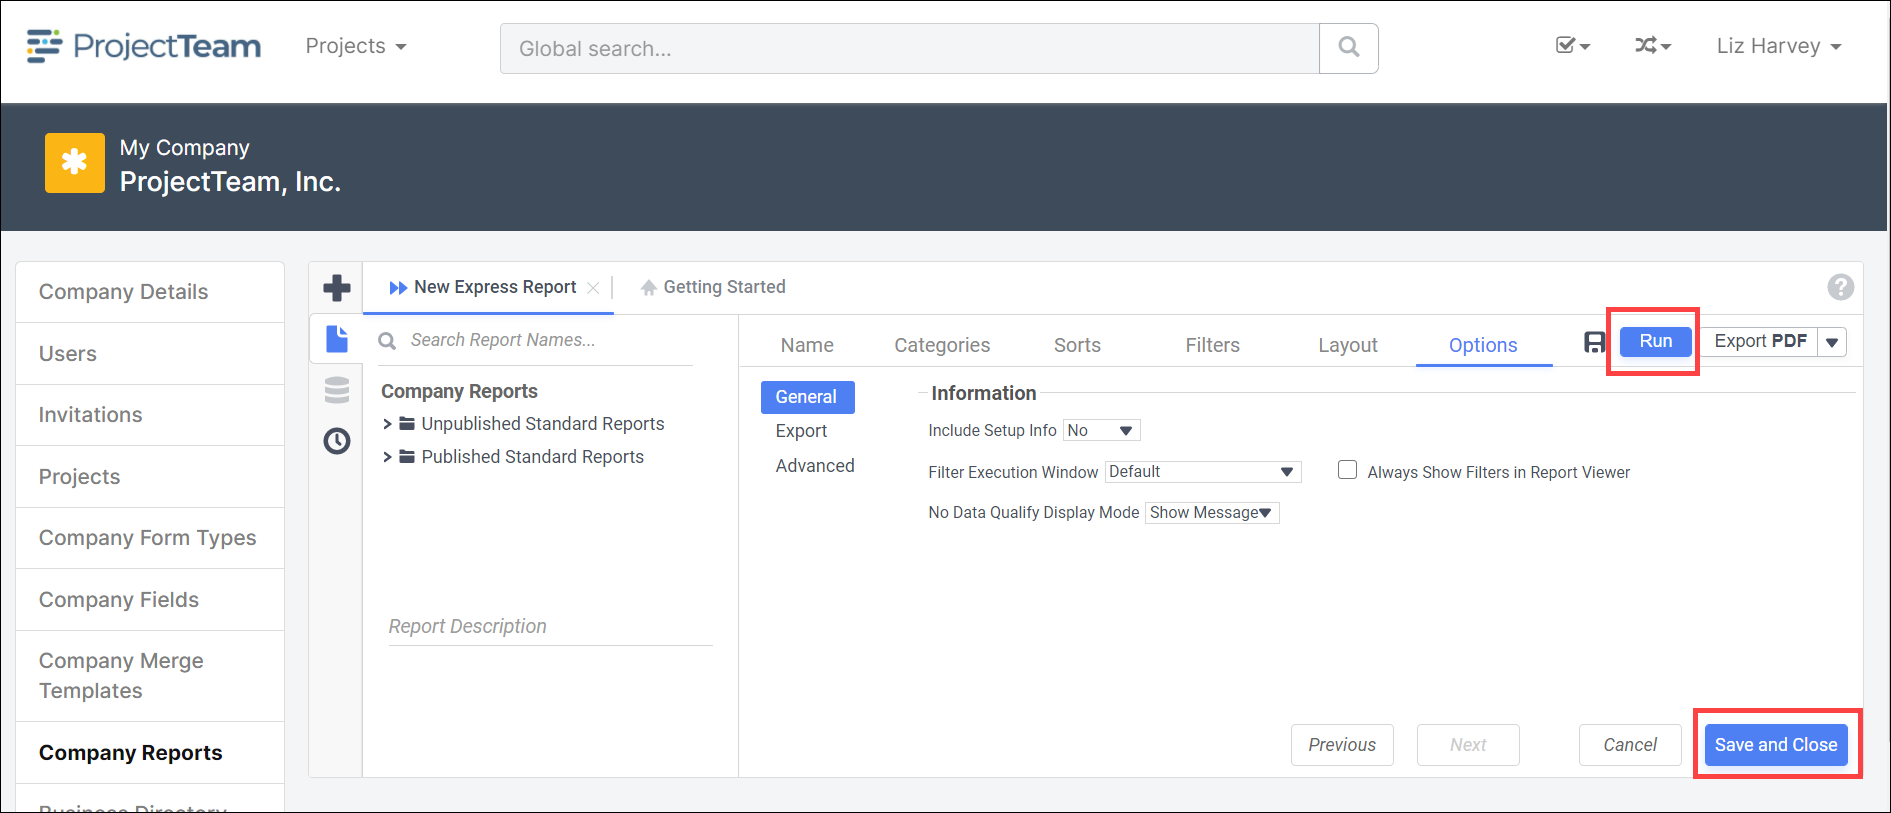
- Click the Next button or Options, this is where you can set any options that you would like applied to your report.
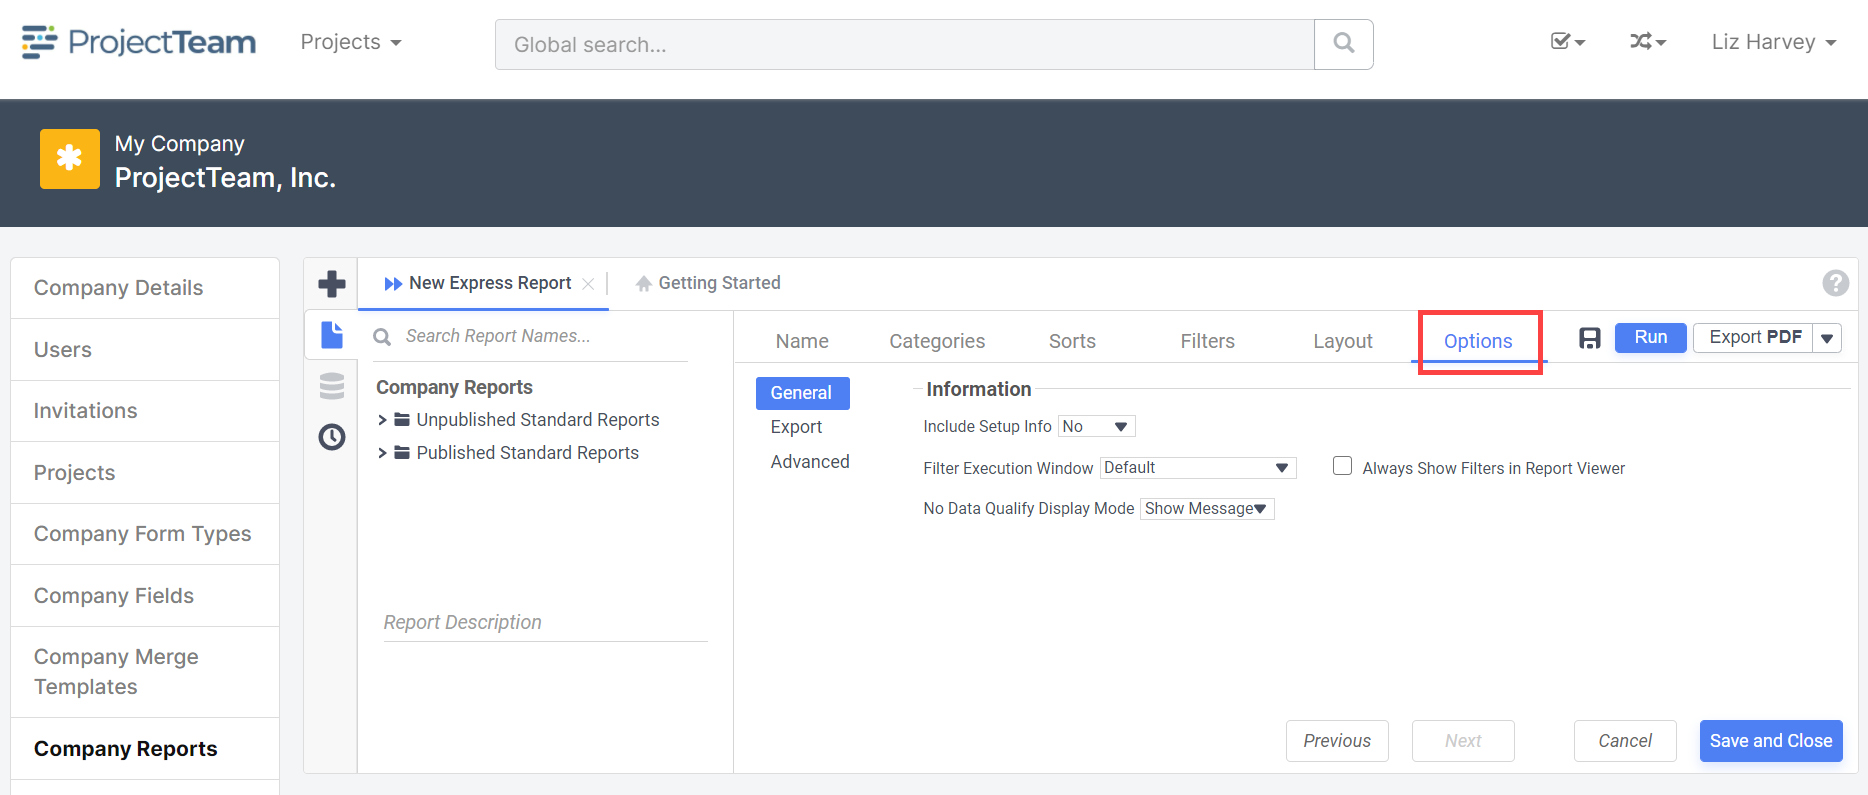
- Click the Save and Close button or click the Run Report button to view the report.
- Enter the report name in the blank field.
- Advanced Report – Create reports containing charts, maps, gauges, and images. Add group sections to provide more flexibility in how data is displayed.
- Enter the report name in the blank field.
- Select appropriate folder to create report within.
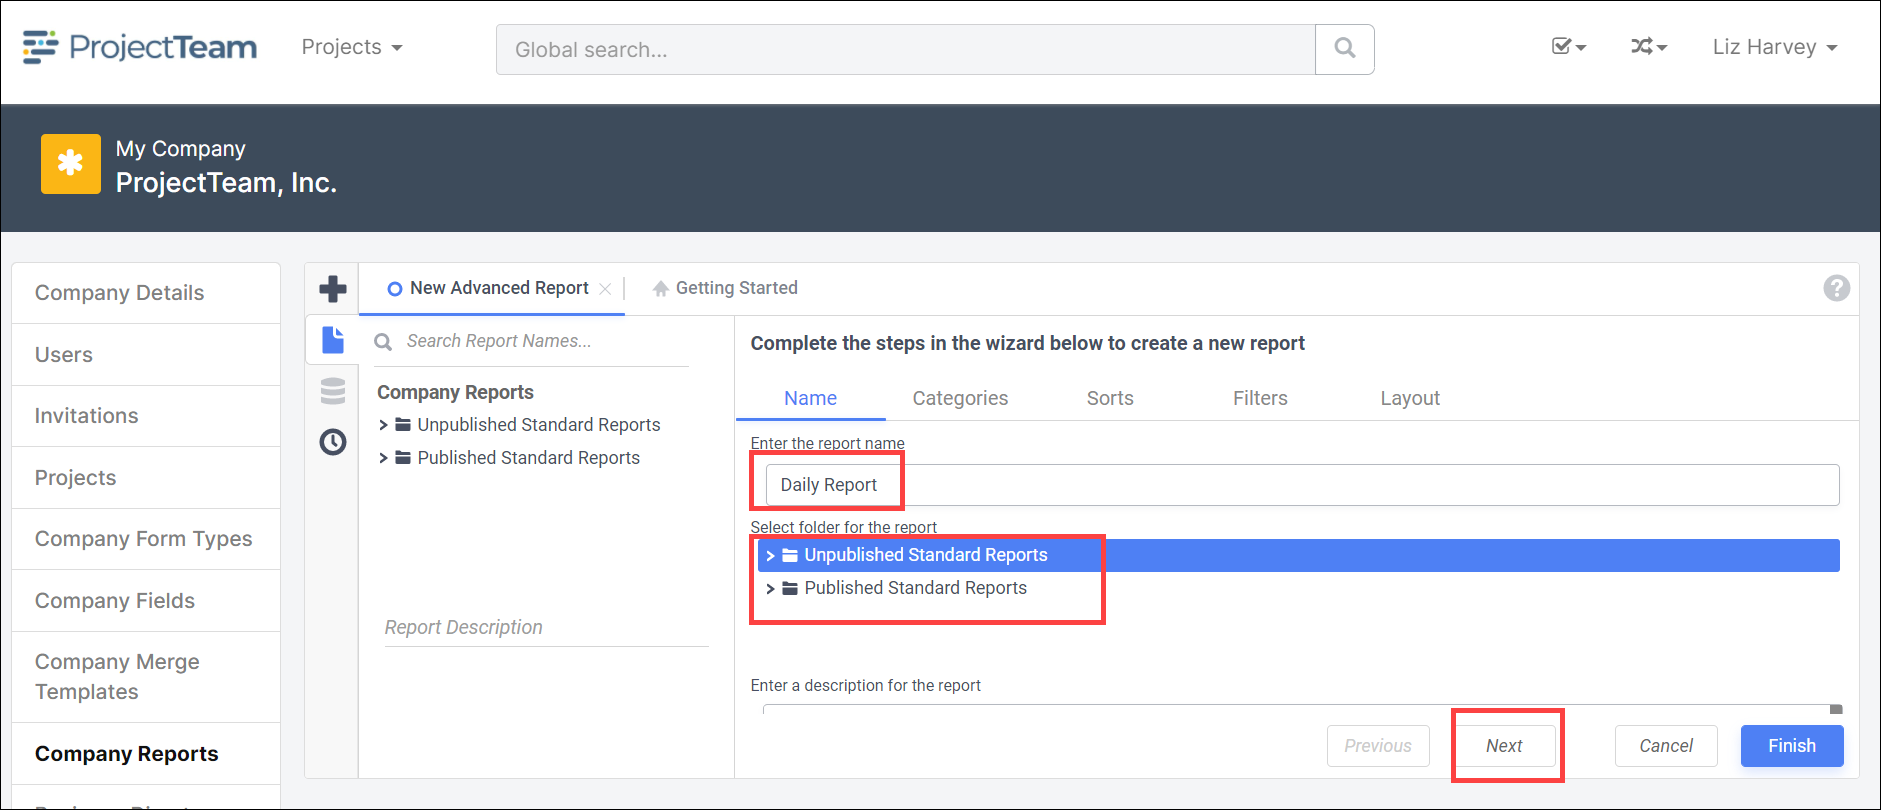
Note: It is recommended to create the report in the Unpublished folder first. Once a report has been created it can be moved to the Published folder. Reports in the Published folder will display in the reports within a project under My Company Access\Standard Reports.
- Click the Next button or Categories, select form types to be included in report. Click plus icon at the bottom of the list or the arrow icon next to appropriate form type to add to the report.
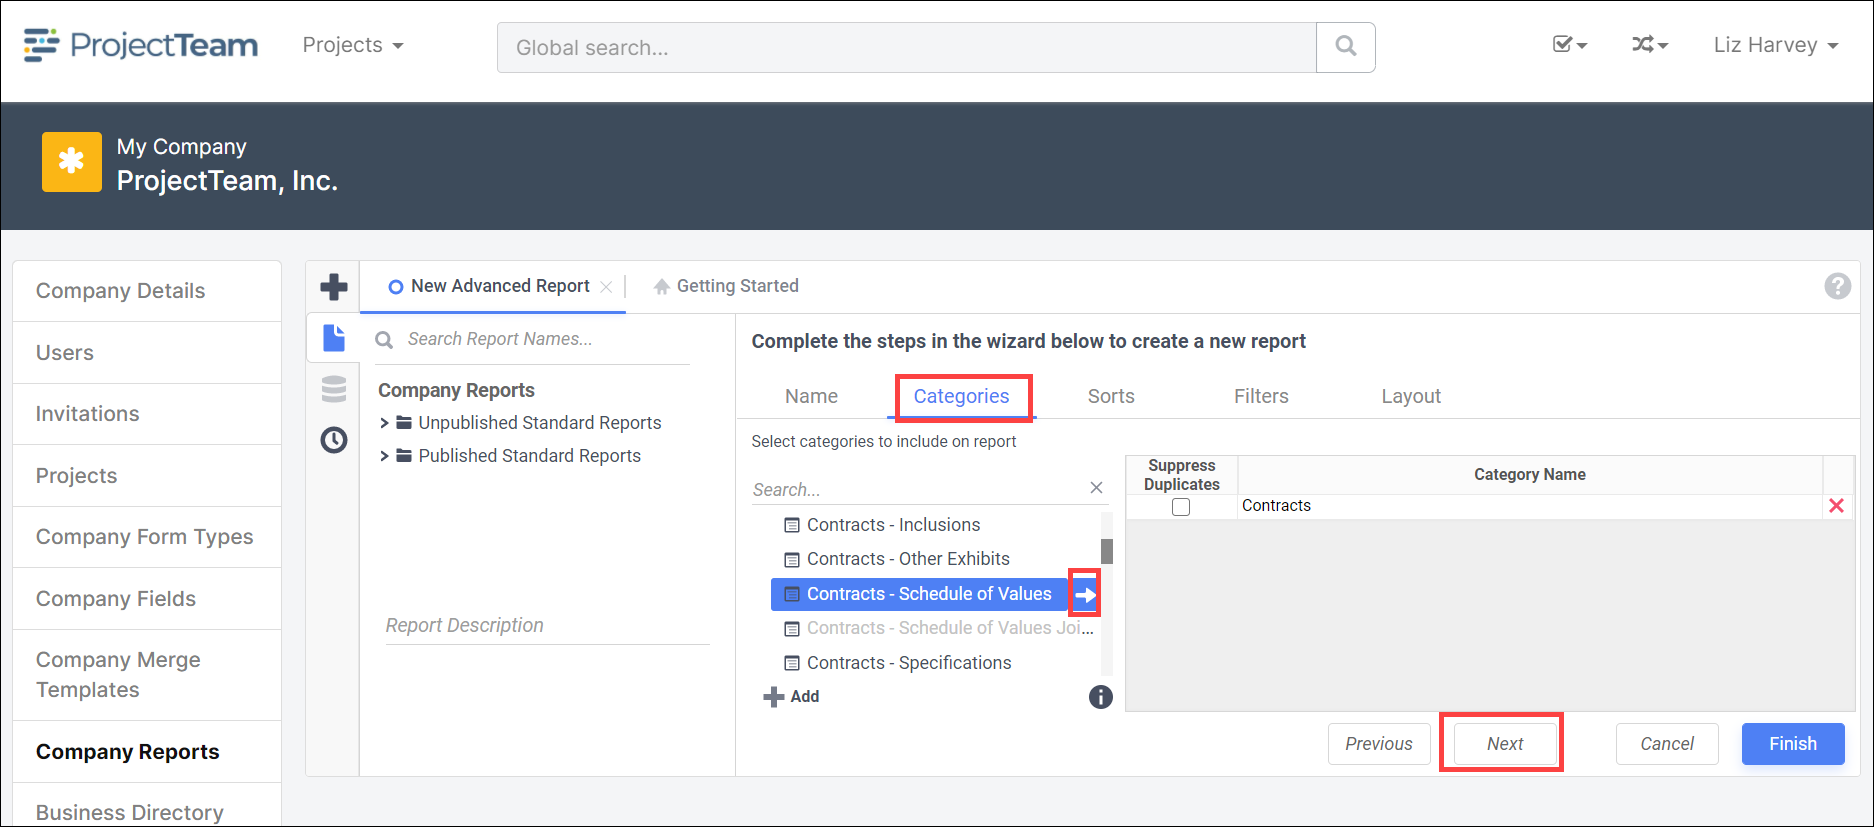
Note: Multiple form types may be added to a Company Report but any project custom from types cannot be added to Cross Project Reports. - Click the Next button or Sorts, Click plus icon at the bottom of the list or the arrow icon next to appropriate field type to add to the report.
Note: Sorts may be applied to the field types. With the Field Type selected, choose the appropriate sort to apply to the report.
- Click the Next button or Filters, select form type from the drop down and appropriate field. Click plus icon at the bottom of the list or the arrow icon next to appropriate field type to add to the report.
Note: Filters may be applied to the field types. With the Field Type selected, choose the appropriate filter value to apply to the report.
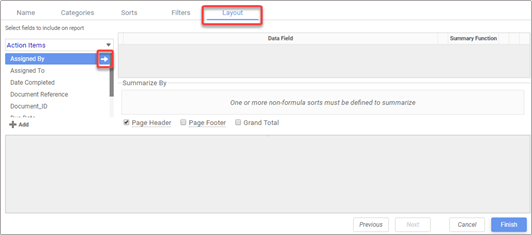
- Click the Next button or Layout, select the field type to include in the report. Click the arrow icon to add to Data Field.
- Click the Finish button.
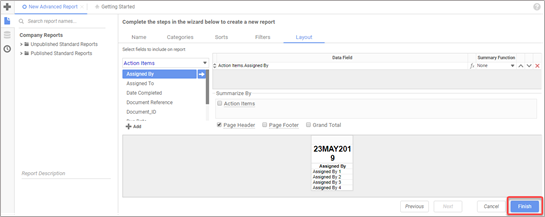
- To view the report, click the Run Report button.

- Enter the report name in the blank field.
- Crosstab Report – Create reports that pivot data. The number of columns and rows in the crosstab expands based on the data itself.
- Enter the report name in the blank field.
- Select appropriate folder to create report within.

Note: It is recommended to create the report in the Unpublished folder first. Once a report has been created it can be moved to the Published folder. Reports in the Published folder will display in the reports within a project under My Company Access\Standard Reports.
- Click the Next button or Categories, select form types to be included in report. Click plus icon at the bottom of the list or the arrow icon next to appropriate form type to add to the report.

Note: Multiple form types may be added to a Company Report but any project custom from types cannot be added to Cross Project Reports.
- Click the Next button or Filters, select form type from the drop down and appropriate field. Click plus icon at the bottom of the list or the arrow icon next to appropriate field type to add to the report.
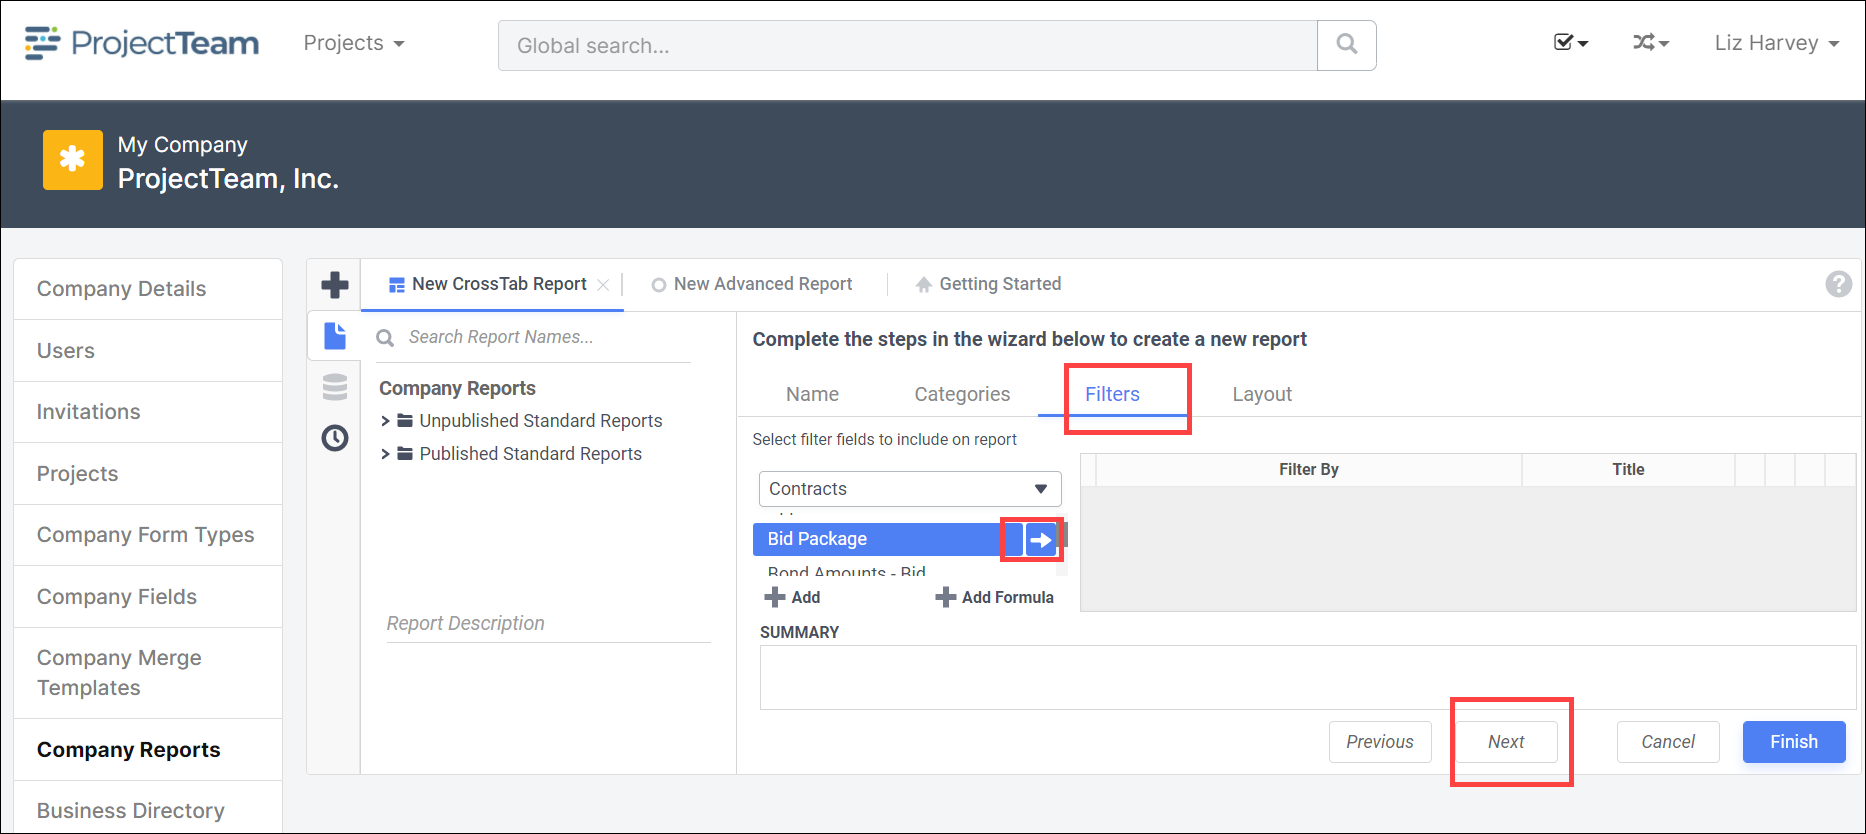
Note: Filters may be applied to the field types. With the Field Type selected, choose the appropriate filter value to apply to the report.
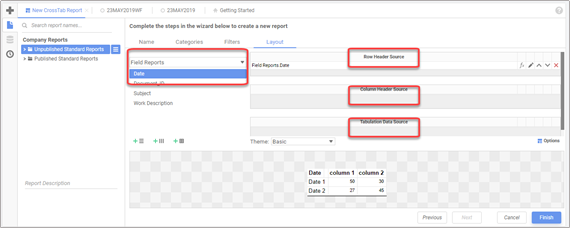
- Click the Next button or Layout, drag and drop the field type into the appropriate Source (Row Header, Column Header, Tabulation Data are all required).
- Click the Finish button.
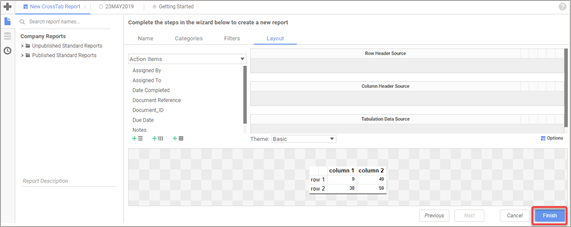
- To view the report, click the Run Report button.
