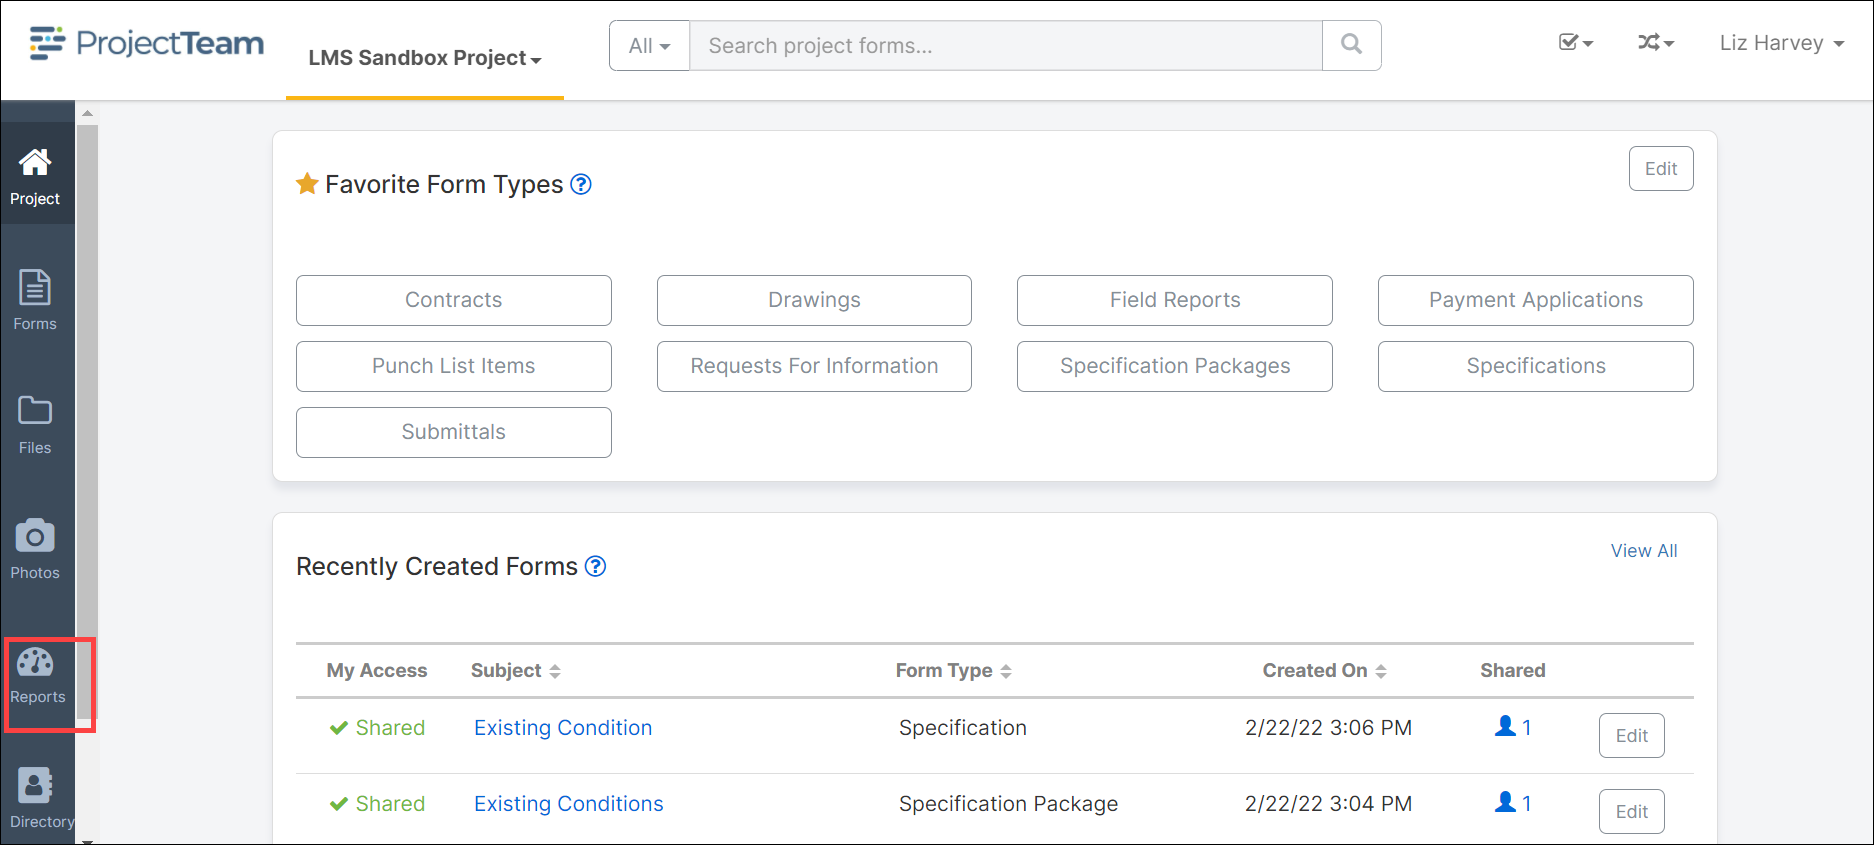
- From the project home page, click on the Reports module.
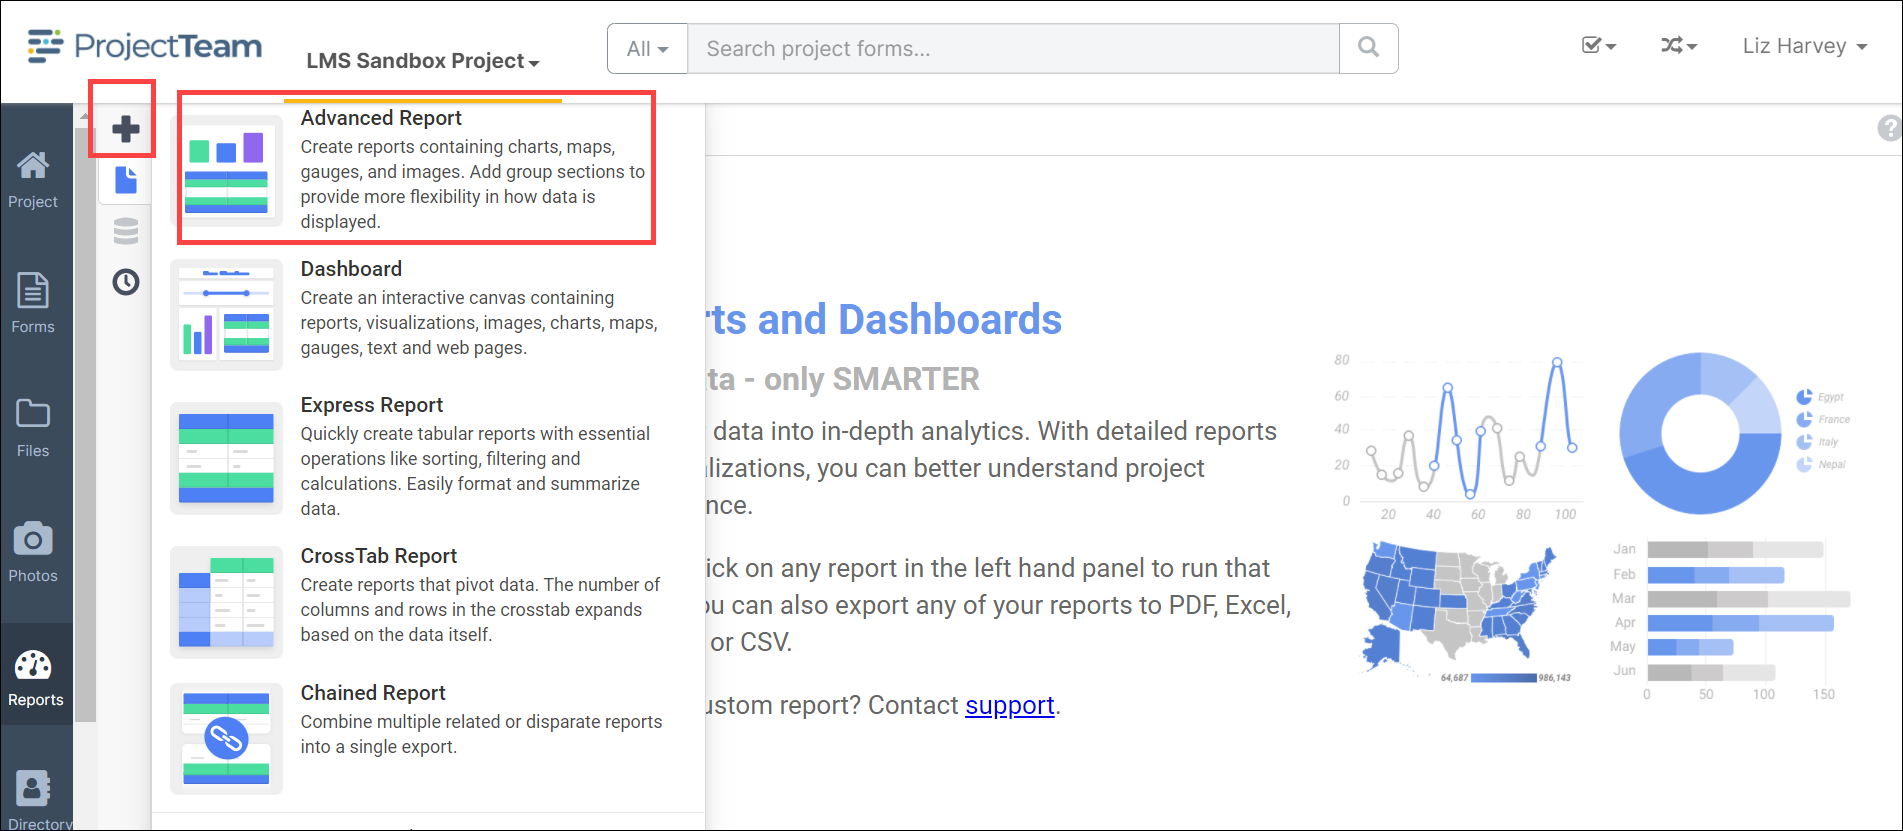
- Next, click on the Plus sign. Then click Advance Report.
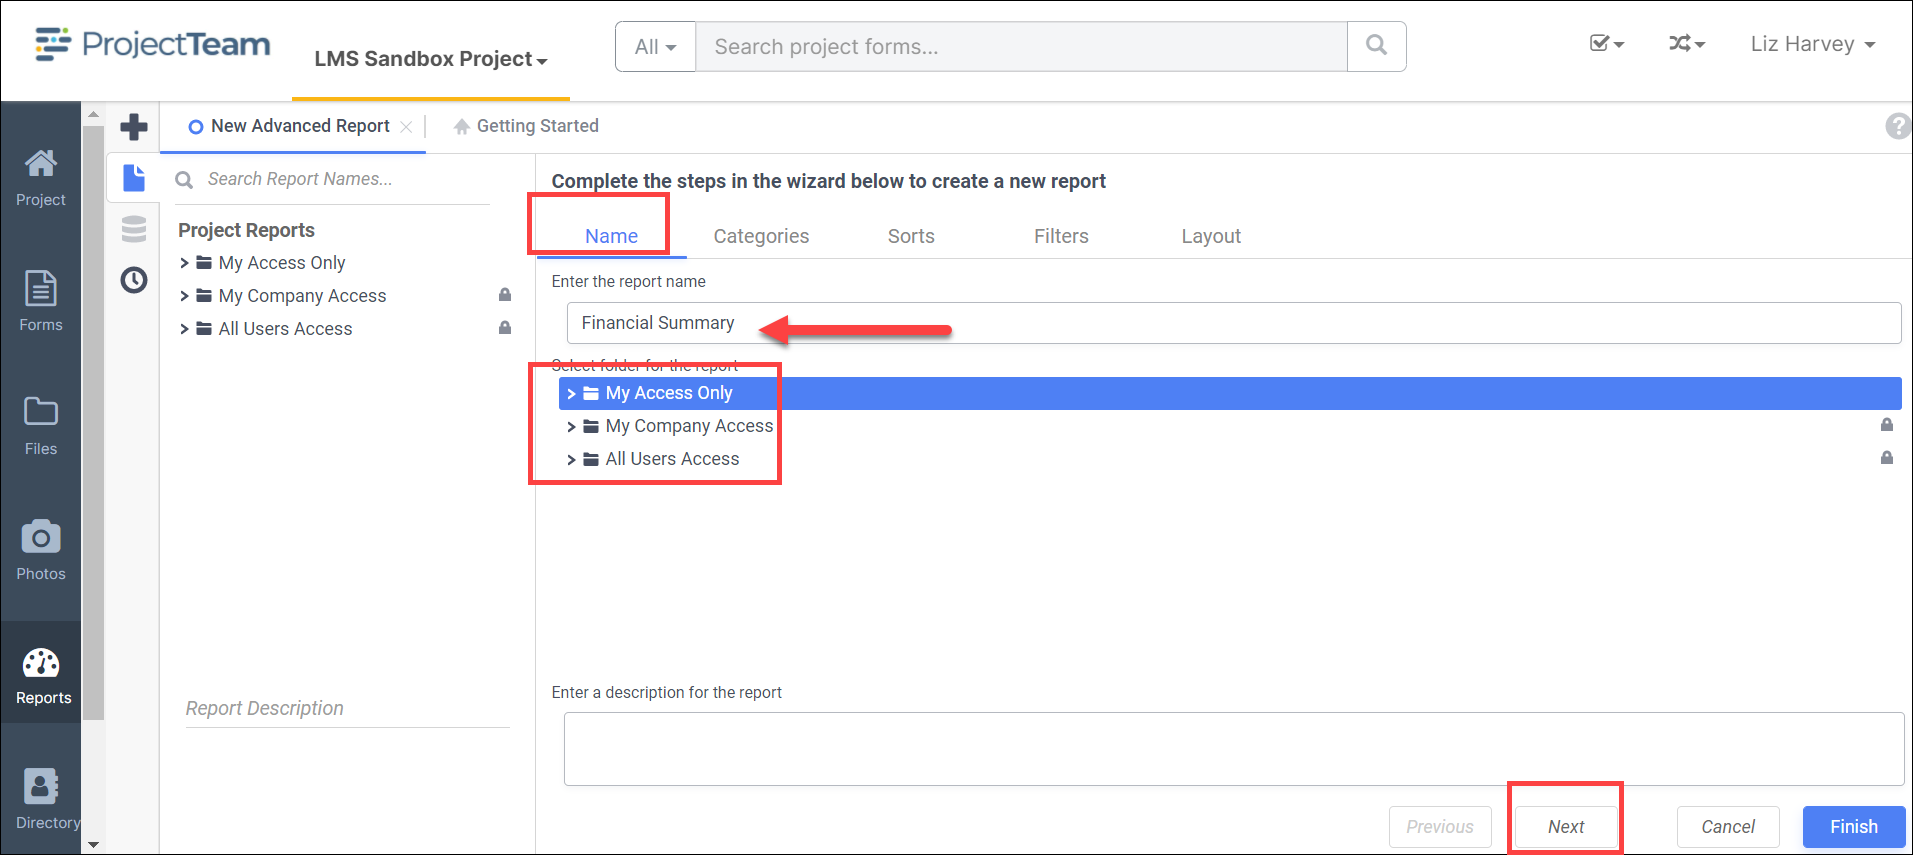
- The Report Wizard for Advanced Reports has five sub-tabs. The Name and Categories tabs must be completed while the other tabs are optional.
In the Name Tab, enter a report name and click on the Folder where the report will be saved.
The report name can be up to 255 characters. Avoid special characters such as ? : / \ * “ < >.
The report’s description appears at the bottom of the Main Menu when it is selected. The description text is also used when searching for a report.
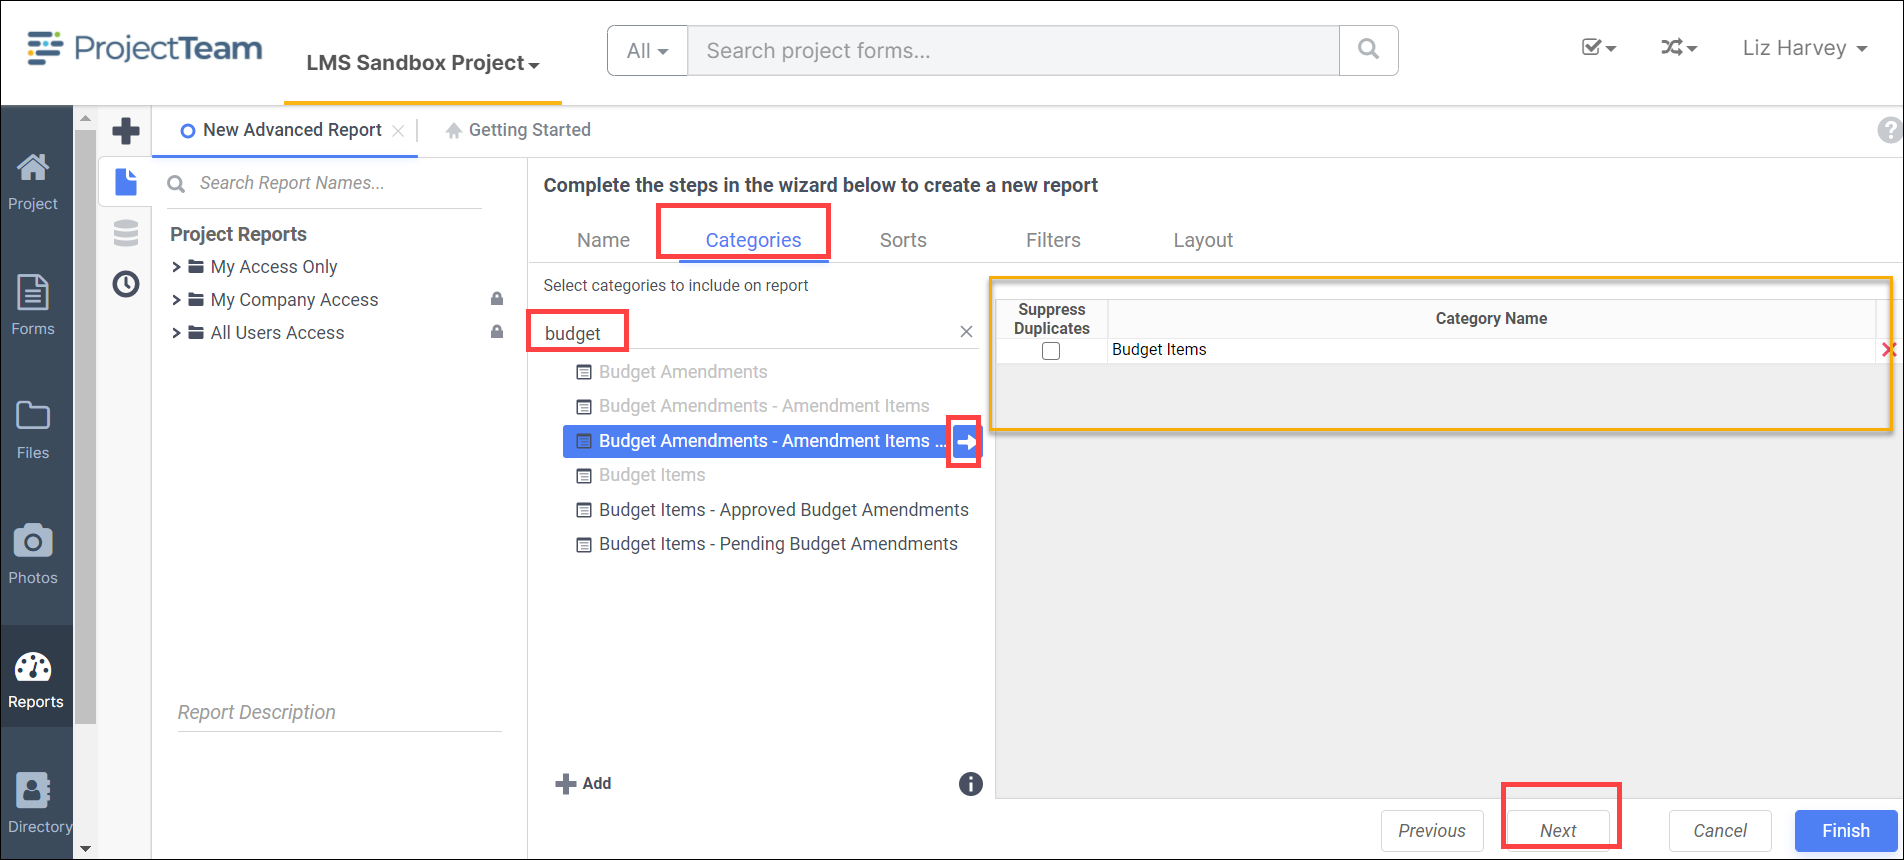
In the Categories Tab, select the Data Categories that you would like to have access to on the report. It is important to understand two terms: Data Category and Data Field.
Data Category
A Data Category is a data object that has several attributes. E.g., Contracts is a category; each Contracts has a Document ID, a Contract Number, a Contract Date, etc.
Data Field
A Data Field is a single attribute within a category. E.g., DocumentID is the numeric value that identifies a specific Contract.
-
-
To add a Data Category, either drag and drop it to the "Category Name" column, use the +Add button, or double-click it
-
To search for a specific Data Category or folder, type its name into the Search box
-
To see what Data Fields are in a Data Category, click the information icon (i) at the bottom right of the Categories list
-
Check the "Suppress Duplicates" box to suppress any repeated records from that category
-
To remove a Data Category, click the delete (x) icon
-
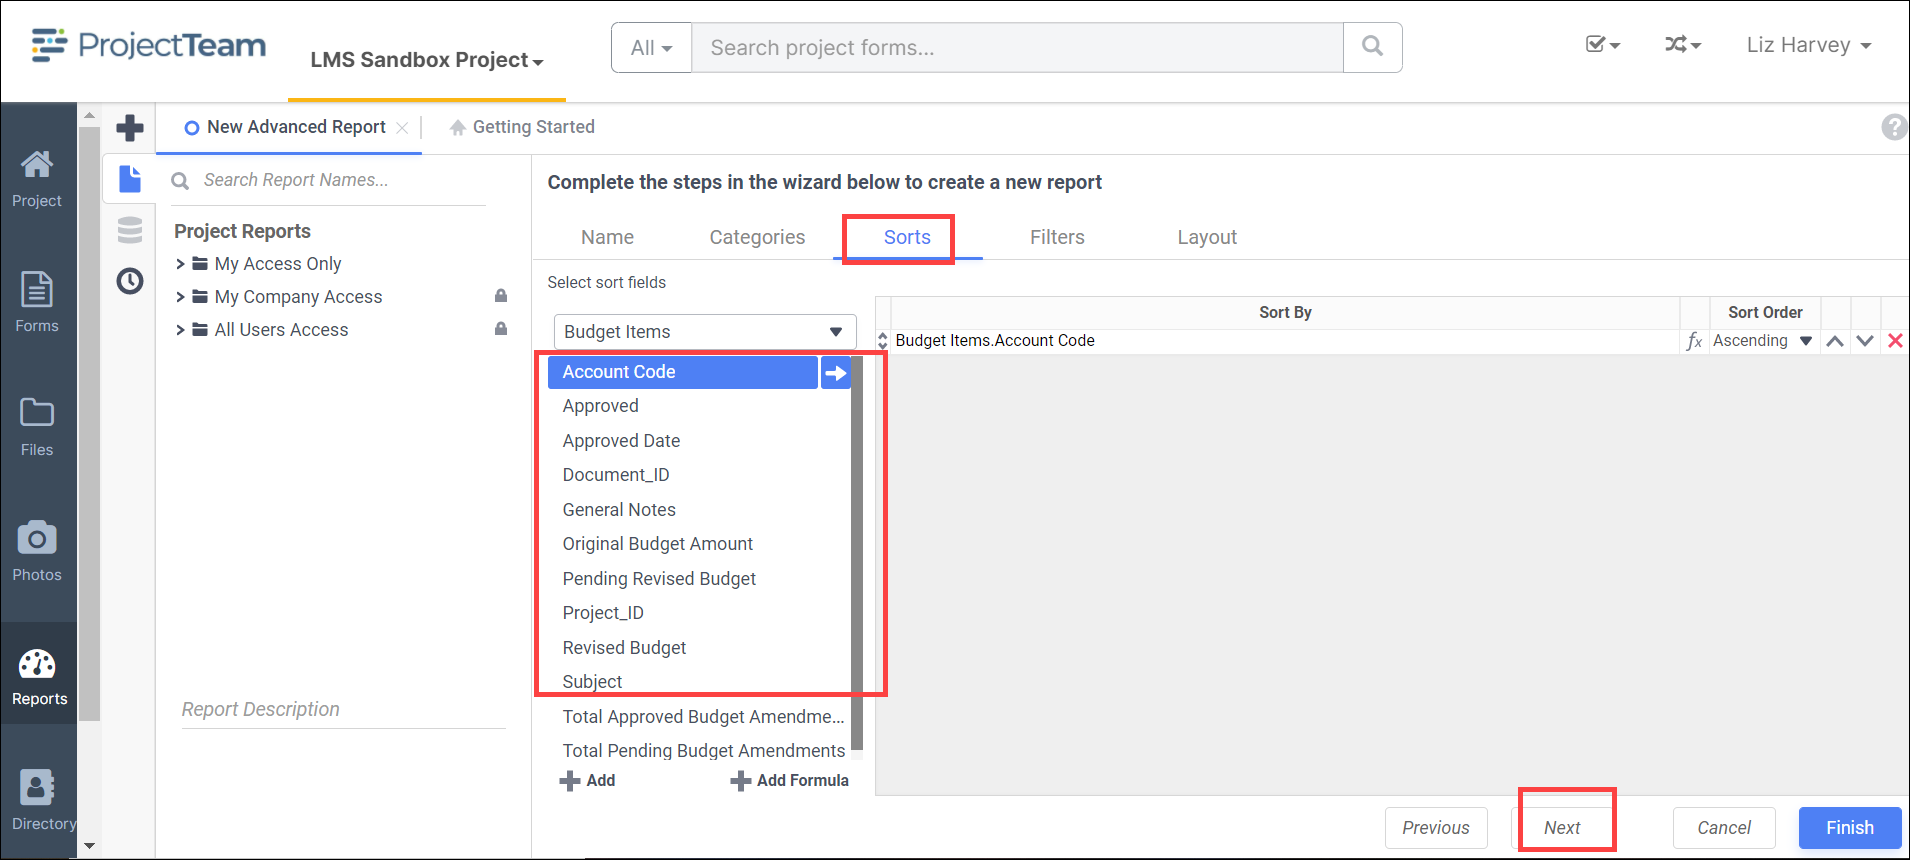
In the Sorts Tab, specify which Data Fields will be used to determine the order of data on the report.
-
To sort by a Data Field, either drag and drop it to the "Sort By" column, use the +Add button, or double-click it
-
You can sort each Data Field in ascending (A- Z) or descending (Z-A) order
-
Use the up and down arrows to indicate the sort priority
-
To remove a sort, click the delete (x) icon
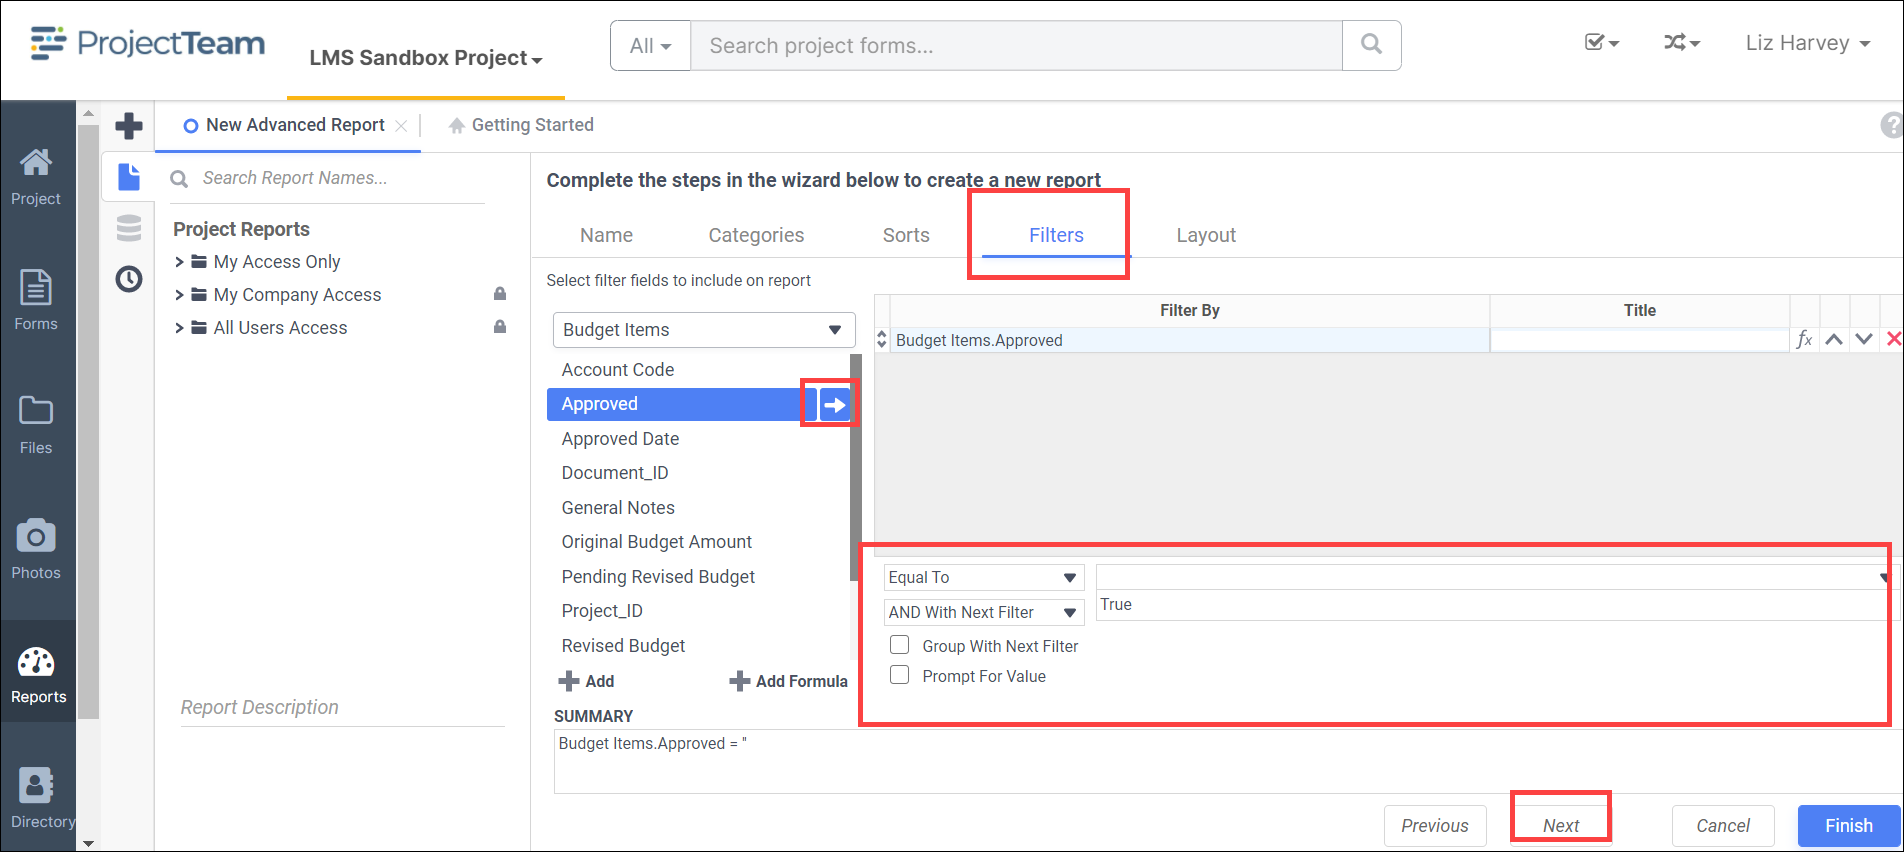
In the Filters Tab, create statements that will be used to filter the data when you execute the report.
There is no limit to the number of filters that can be defined. Filters can be numeric (up to eight decimals) or alphanumeric
-
To filter a Data Field, either drag and drop it to the "Filter By" column, use the button, or double-click it
-
Use the up and down arrows to indicate the filter priority
-
To remove a filter click the delete (x) icon
-
Set the operator (equal to, less than, one of, etc.) by selecting it from the operator drop-down.
-
Set the filter value by either entering it manually or selecting a value from the drop-down. If the Data Field is a date, the calendar and function buttons can be used to select a value.
-
Check "Prompt for Value" to allow the filter to be modified at the time the report is executed
-
Select "AND With Next Filter" to require that the selected filter and the one below it are both true
-
Choose "OR With Next Filter" to require that either the selected filter of the one below it be true
-
Check "Group With Next Filter" to specify the precedence of the filters
-
Filters can be nested indefinitely by using the following keyboard shortcuts while a filter is selected
In the Layout Tab, select which Data Fields that will appear on the report. For each Data Field chosen, the report will automatically create a column header and the Data Field. Additionally, subtotals, grand totals, and page header/footers can be created.
Display Data
-
-
To place a Data Field on the report, either drag and drop it to the "Data Field" column, use the +Add button, or double-click it
-
Use the up and down arrows to indicate the order the Data Fields should appear on the report (the Data Field at the top will appear on as the leftmost column of the report)
-
The Summary Function column is used to make subtotals and grand totals (One or more non-formula sorts must be defined to summarize)
-
To remove a Data Field, click the delete (x) icon
-
Using the ‘Summarize By’ box, you can display subtotals, grand totals, or headers for each unique value of a Data Field.
Subtotals and Grand Totals
-
-
To display subtotals, check the box of the category you want sub-totals for. Then, for each Data Field you want totaled, select a Summary Function (see below).
-
To display grand totals check the Grand Total box. Then, for each Data Field you want totaled, select a Summary Function (see below)
-
Sum: Totals the all of the data in the Data Field
-
Count: Returns the number of rows in the Data Field
-
Average: Takes the mean of the data in the Data Field
-
Minimum: Displays the lowest value in the Data Field
-
Maximum: Displays the highest value in the Data Field
-
Data Headers
A check box will appear in the "Summarize By" box for each Data Category in the Sorts Tab. To display a header for each value of a Data Field, click on the associated Data Category in the "Summarize By" box. Click the Data Category name next to the checkbox, and the Header Menu will appear.
-
-
To include a Header, check the box "Include Header at the beginning". In order to select the text that will appear as the header value, use the Header dropdown to select a Data Field or use the Formula Editor Button (fx) to create a formula
-
Use the "Summarize by each unique" dropdown to specify if the header should repeat based on a specific field or fields within a Category
-
Check the box "Include Total at the end" to have a subtotal created for this Category
-
Page Header
To display information on the top of each page, click "Page Header" below the "Summarize By" box. A Page Header Menu will appear.
-
-
Check the box "Include Title at the top of every page" to display the name of the report on each page. If an image is also included, use the position dropdown to set where the title should appear and the number of columns it should span.
-
Use the "Change Image" button to upload an image to display at the top of each page. If a title is also included, use the position dropdown to set where the image should appear and the number of columns it should span.
-
Footers
To display information on the bottom of each page, click "Page Footer" below the "Summarize By" box. Click "Page Footer" next to the checkbox, and the Page Footer Menu will appear.
-
-
Check the box "Include page number at the bottom of every page" to display the page number on each page. If an image is also included, use the position dropdown to set where the page number should appear and the number of columns it should span
-
Use the "Change Image" button to upload an image to display at the bottom of each page. If the page number is also included, use the position dropdown to set where the image should appear and the number of columns it should span
-
Preview Window
At the bottom of the Layout Tab, a preview will display how the report will appear based on the fields that have been added. You can increase/decrease the size of the preview or hide it altogether by dragging the top of the Express Report Designer box.